Climate Science
This is by no means a comprehensive list of climate science sites. It's meant to give a quick overview of the need to decarbonize as soon as humanly possible.
Main Sites
UN Framework Convention of Climate Change Newsroom | Climate NASA | Carbon Monitor | Climate Clock | Global Carbon Project | Global Warming Index | What is net-zero?
Latest News
9/17/2021 Full NDC Synthesis Report: Current NDCs are insufficient to lower warming than 2.4ºC at 2100, and the present trajectory currently best matches SSP2-4.5 resulting in 3ºC by 2100.
9/16/2021, https://doi.org/10.1038/s41558-021-01142-2: Implemented policies 2.9–3.2°C, Paris Agreement Pledges 2.4–2.9°C, All Net Zero targets: 2.0 to 2.4°C
News archive
Vox coverage on Green New Deal
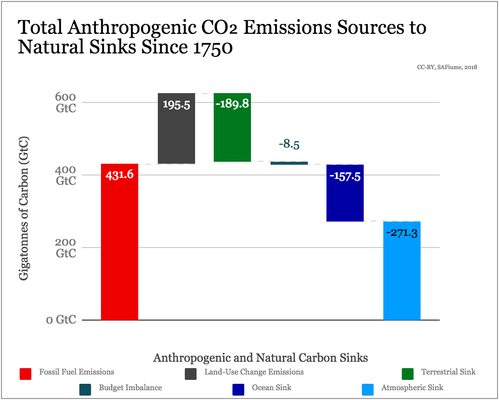
Every year the Global Carbon Budget releases progress on current atmospheric CO2 and GHGs levels. For 2018 emissions are projected to rise to a growth of 2% (projected 1.7% - 2.8%), after 2017 ended with 1.6% growth and 2016 was flat[2].
Global Carbon Budget 2018 Infographics
Notable Coverage
Vox: IPCC Special Report, and links this year's UNFCCC meeting: COP24.
Climate Change Exposé, New York Times: Losing Earth: The Decade We Almost Stopped Climate Change
Forbes: Growth for Cleantech and Clean Energy Markets
Carbon Brief: Reaching 1.5ºC will be challenging at best.
Latest CO2 PPM
Atmospheric Anthropogenic Carbon to be Removed
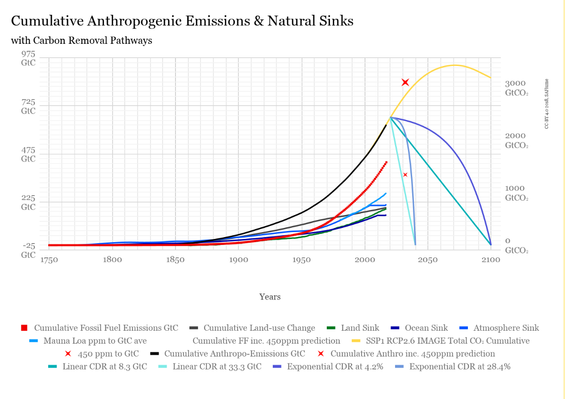
How much Carbon do we need to remove? A rough estimate is 500 Gt Carbon from emissions. This number shoots up close to 700 Gt Carbon if the Land Sink deteriorates. As of 2017, the total was 627 Gt Carbon.
The red eXes are extrapolations of when we'd hit 450ppm from the light blue Mauna Loa ppm to GtC average curve. This assumes the current exponential growth rate continues unheeded till 450 ppm. 450ppm is projected to happen by 2032. The solid black line is the amount of fossil fuel emissions combined with land-use change emissions which are projected to be in the atmosphere to cause 450 ppm.
Carbon Removal of the total cumulative emissions could look like the decline splines shown in teal or purple.
Note, to go a step beyond pure carbon dioxide sequestration and fully remove carbon from the global carbon cycle, carbon can be solidified to stop it from expediting climate change.
radiative forcing 3]
Exit Cryosphere Stability Zone
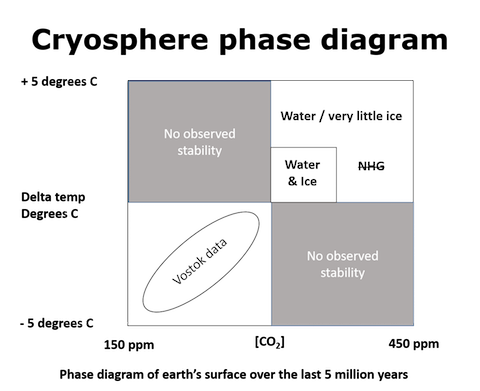
If one models global temperature and atmospheric carbon dioxide concentration (CO2 PPM) over the last 5M years using the Antarctic Vostok Ice Core data correlated to ice sheet existence, a large region emerges which includes data points starting with Northern Hemispheric Glaciation at about 2.7M years to just prior to the present. This data correlates a range of atmospheric CO2 concentration from 180 CO2 PPM[4] to sub 370 CO2 PPM[5] to temperatures that stay within a change of 2.5 Cº, over the last 2.7 M years. Outside of 2.7M years, we observe higher temperatures and CO2 concentration and radically reduced Arctic ice sheet, glaciers, and radically raised ocean levels.[5] At present, Earth's climate is exceeding the previous stability zone due to increased global surface temperature and atmospheric CO2 concentration, leading to radical changes to global oceanic oscillations, and possible shutdown of the thermohaline circulation[6] and increased reduction in polar ice sheets and further sea-level rise. The shear fact that CO2 concentration has surpassed that during the Northern Hemispheric Glaciation point should raise great concern.
Additionally, historically the change in CO2 concentration happened at a slow rate on the order of 1 ppm per century, whereas humans have caused changes on the order of about 100 ppm per century. "And the system variables (carbon dioxide and temperature) are now "decoupled" in the sense that we are far from equilibrium (rate of change). How global temperature responds to a combination of GHG forcing and loss of albedo (surface melting in Greenland) is unknown.", per Assoc. Prof. Robert Cormia.
Image Credit: Assoc. Prof. Robert Cormia of Foothill College
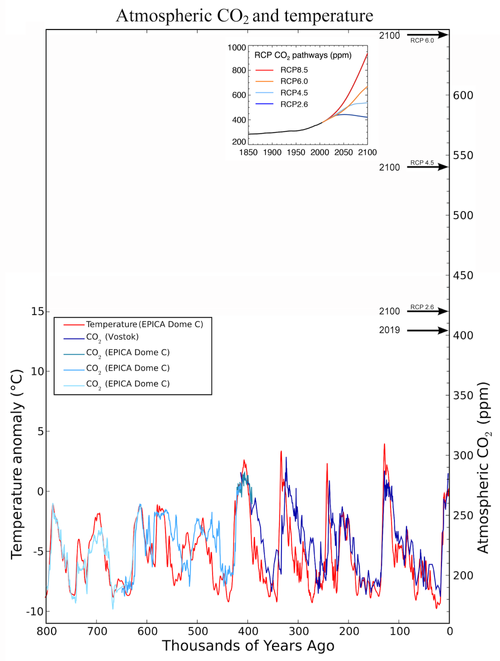
Atmospheric CO2 and temperature
Sources: Atmospheric CO2 and temperature: https://commons.wikimedia.org/wiki/File:Co2-temperature-records.svg
RCP CO2 pathways: https://www.ipcc.ch/report/ar5/wg1/carbon-and-other-biogeochemical-cycles/fig6-25-3/
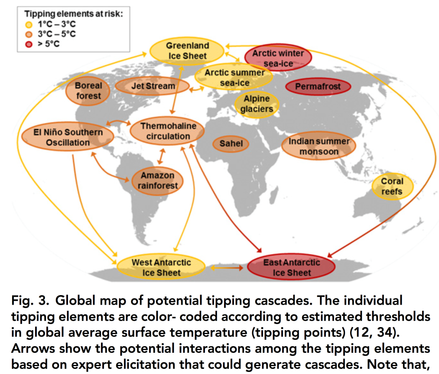
Tipping elements and points in the climate system
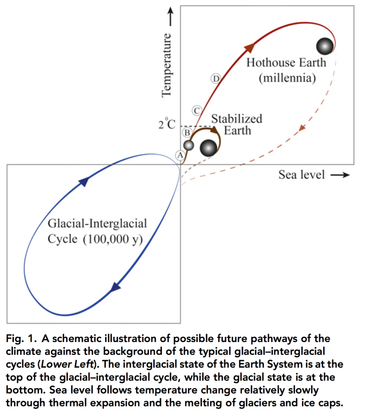
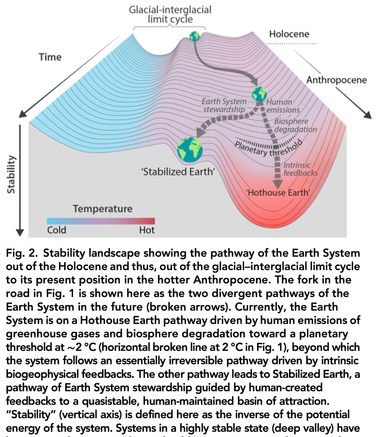
Trajectories of the Earth System in the Anthropocene
Steffen et al., 2018
"We explore the risk that self-reinforcing feedbacks could push the Earth System toward a planetary threshold that, if crossed, could prevent stabilization of the climate at intermediate temperature rises and cause continued warming on a “Hothouse Earth” pathway even as human emissions are reduced. Crossing the threshold would lead to a much higher global average temperature than any interglacial in the past 1.2 million years and to sea levels significantly higher than at any time in the Holocene. We examine the evidence that such a threshold might exist and where it might be. If the threshold is crossed, the resulting trajectory would likely cause serious disruptions to ecosystems, society, and economies. Collective human action is required to steer the Earth System away from a potential threshold and stabilize it in a habitable interglacial-like state. Such action entails stewardship of the entire Earth System—biosphere, climate, and societies—and could include decarbonization of the global economy, enhancement of biosphere carbon sinks, behavioral changes, technological innovations, new governance arrangements, and transformed social values."
References
New scenarios show how the world could limit warming to 1.5C in 2100 https://www.carbonbrief.org/new-scenarios-world-limit-warming-one-point-five-celsius-2100
Global Carbon Budget 2018 https://doi.org/10.5194/essd-10-2141-2018
Global Carbon Budget 2017 https://doi.org/10.5194/essd-10-405-2018
Stable Carbon Cycle–Climate Relationship During the Late Pleistocene https://doi.org/10.1126/science.1120130
The role of CO2 decline for the onset of Northern Hemisphere Glaciation https://doi.org/10.1016/j.quascirev.2015.04.015
Role of tropics in changing the response to Milankovich forcing some three million years ago https://doi.org/10.1029/2002PA000837
Natural and anthropogenic changes in atmospheric CO2 over the last 1000 years from air in Antarctic ice and firn
NCDC NOAA Lawdome Data
Steffen et al., 2018, Trajectories of the Earth System in the Anthropocene, https://www.pnas.org/content/115/33/8252.full
Open NanoCarbon and all content is licensed under CC-BY: Creative Commons Attribution 4.0 International License, except where otherwise listed.
CC Icons by The Noun Project. Wiki sponsored by Atlassian.

