Description
Model large-scale carbon dioxide removal and greenhouse gas phase-outs to verify temperature achieving close to 0ºC over the mean global temperature of 1850-1900 by 2100.
This paper runs a multi-step experiment on the climate model emulator (or reduced complexity model) MAGICC 6.8 to provide rationale for further exploration within an Earth System Model (ESM) to better project the climate under modest feedbacks while realizing final temperature evolution to match pre-industrial.
ONC doesn't have the funds or resources to run the experiments on a newer CDRMIP class Atmosphere-Ocean General Circulation Model (AOGCM).
About These Papers
These papers were conceived by Shannon A. Fiume in late 2017 during a conversation with Peter Fiekowsky as she was unable to find in the literature a way to return to the preindustrial climate within a hundred years of the present date while verifying how much carbon could be removed by scaled CDR in an exponential manner. By backtracking to the larger scoped question, if we were to target a lower temperature or preindustrial itself, this new goal could add an additional pathway to a more restored climate. Potentially this new goal could help limit damages by providing more literature for reducing emissions faster in the near term. Given the scientific gap, this project then shifted from a goal for ONC of what is the upper bound of carbon we ought to remove to the larger question of how much carbon would humans need to remove or have completed by 2100 in order to shift the climate back as close as possible to 0ºC over pre-industrial. See Shannon Fiume's comments on the CDR mailing list and Twitter for her conversations with the CDR community.
These papers are scoping exercises and technology-agnostic and as such, don't inherently fall into the category of presenting a Moral Hazard. To be more explicit, to achieve net-zero the fastest, mitigate a high-risk climate, limit further ecological loss and damages, and prepare to scale (fossil fuel-less) negative emissions for the next 70 years, it's necessary to have fossil fuels phased out as soon as possible and as such fossil fuels are therefore inappropriate to be used as a scaled source to generate net-zero or net-negative emissions. Humans have too many cumulative emissions to remove (think of running the carbon budget in reverse) to also add new emissions in any sizeable quantity.
Papers
Theory paper
Presented version: Targeting All Anthropogenic Carbon Dioxide Emissions (2018)
PrePrint (non-peer-reviewed) Revised version: Alternative Method to Determine a Carbon Dioxide Removal Target (2018), https://doi.org/10.1002/essoar.10503117.1
Author: Shannon A. Fiume
Description: A short paper outlining how much carbon we need to solidify for complete climate restoration and the carbon's location. It shows why 300 ppm and less need to be fully explored for complete climate restoration.
ExperimentalValidationPaper
Letter title: CDR modeled in MAGICC to return to preindustrial temperatures by 2100.
Experiments performed in collaboration with Foundation for Climate Restoration. The experiments to test how to achieve 300 ppm, then 280 ppm.
Author: Shannon A. Fiume
Abstract
Experimental test of the theory proposed in an Alternative Method to Determine a Carbon Dioxide Removal Target. The multi-step experiment explores halting anthropogenic emissions from greenhouse gases and removing all historic cumulative anthropogenic carbon dioxide emissions in less than a hundred years to match the preindustrial temperature. The multi-step experiment was conducted on MAGICC 6.8, a reduced complexity model or model emulator, managed by pymagicc. The experiment compares the new experimental pathway 300x2050, marker SSP1 2.6, and SSP1 1.9 within the context of development under a green growth paradigm and explores large-scale linear carbon dioxide removal over the 80-year time frame. The multi-step experiment calibrated the experimental pathway to include recent historic emissions through 2020 and was subsequently tuned to model the recent average global temperatures and CO2 concentration through 2020. Contrary to the prior proposed theory all anthropogenic emissions (from both fossil fuels and land-use change) needed to be removed to realize final temperatures close to 0.067ºC relative to 1720-1800 mean. The experimental pathway evolved temperature to 0.13ºC to 1850-1900 mean and realized a final CO2 concentration to 278.82 ppm by 2550. The experimental pathway achieved nearly 0.069ºC relative to 1720-1800 mean and 0.14ºC over 1850-1900 of warming at 2100 after phasing out all greenhouse gases, excluding ammonia and removing all cumulative anthropogenic carbon dioxide.
Introduction
This letter explores climate modeling in MAGICC575799317,575799317,575799317 and outlines how to generate temperatures that roughly match preindustrial at 2100 through scaled Carbon Dioxide Removal. Although the large-scaled CDR experimental pathway of 300 x 2050 is highly implausible with the current technology, the state of the clean energy industry, and know-how, the modeling provides a likely lowest emissions bound and scaled CDR pathway generating temperatures far lower than the marker pathway of Shared Socioeconomic Pathway (SSP) 1 1.9575799317,6,575799317,575799317 within the SSP 1 storyline of ‘development under a green-growth paradigm'575799317. In order to constrain the total amount of carbon needed to be removed from the climate-carbon cycle, the pathway quickly reaches net-zero in the middle 2020s, followed by scaled fossil fuel free CDR.
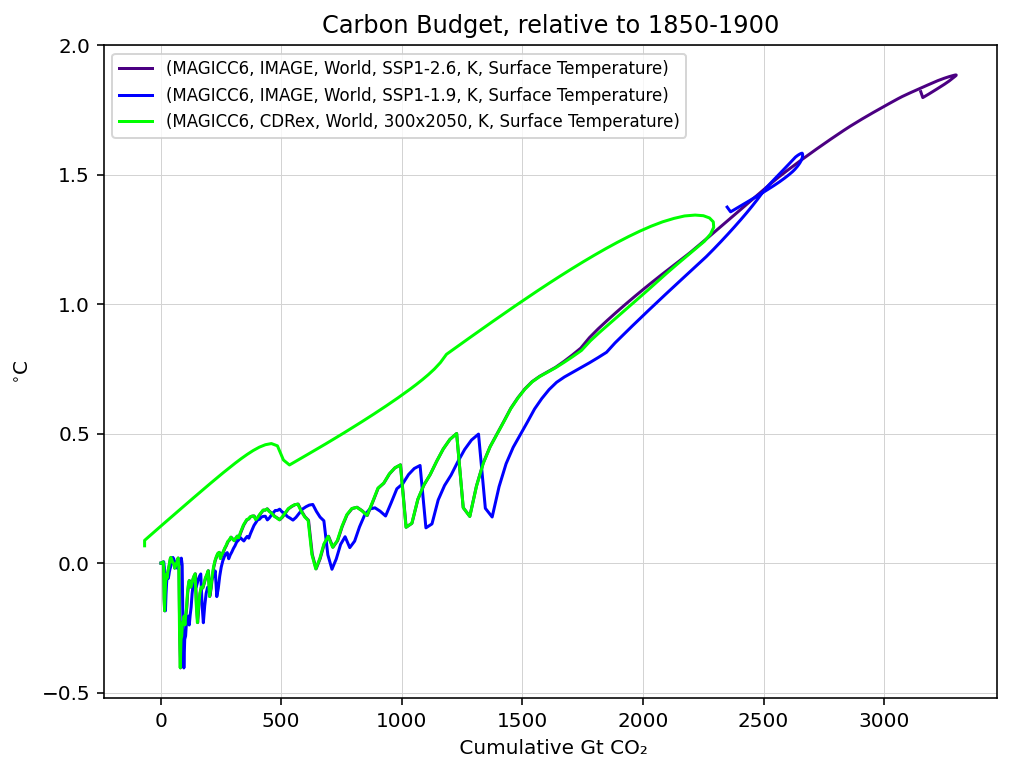
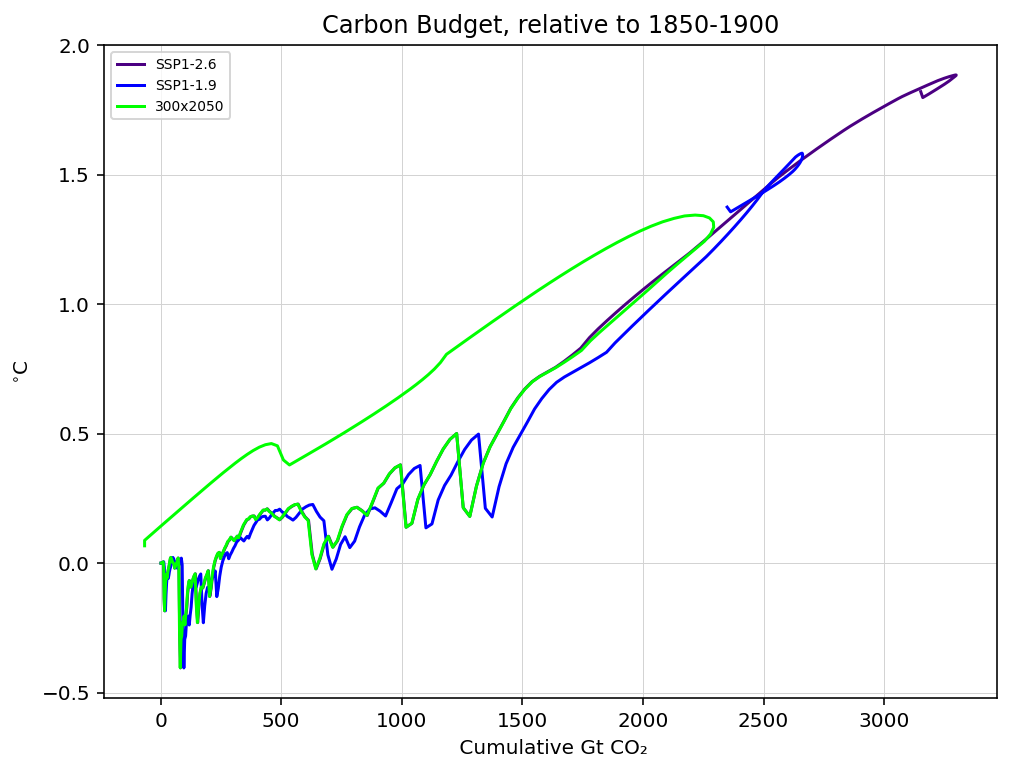
Figure 1: Carbon Budget showing CDR from 1850-2100 for IMAGE SSP 1 2.6, IMAGE SSP 1 1.9, and 300 x 2050.
Results Summary
The novel high carbon dioxide removal experiment pathway named 300 x 2050 details how high rates of Carbon Dioxide Removal evolve Earth's climate in the reduced complexity model575799317: MAGICC 6.8575799317,575799317 over the time span of eighty years and continuing on for an additional 450 years. The results are in the jupyter python pymagicc (2.0)575799317 ONC CDRMEx workbook running MAGICC 6.8. Carbon Dioxide Removal (CDR) was accomplished by negative emissions of carbon dioxide and phase-outs of methane and carbon monoxide as well as all other industrial fossil fuel-based gases excluding ammonia ending by 2100. CO2 removals in this text are specified as a negative quantity of emissions within the experiment parameters and not a technology or set of technologies to be agnostic to the type of implementation. The front-loaded CDR and phase-down of the other fossil fuel and agricultural greenhouse gases realize about 300 ppm by 2050. Even though the removals are agnostic to both technology and implementation, the dual conditions of the massive amounts of CDR and achieving 0ºC by 2100 require a total and full phase-out of fossil fuels over the century.
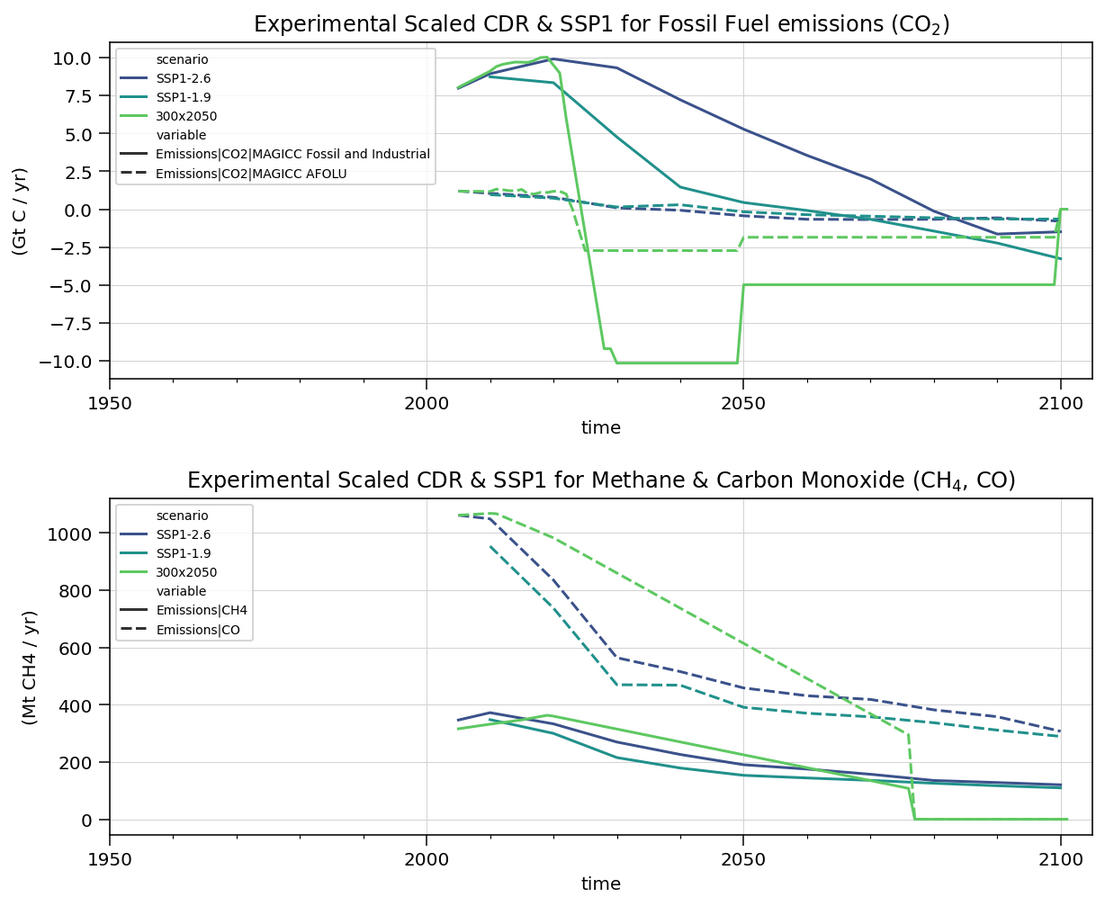
Figure 2. Pathways SSP1 2.6575799317,575799317, SSP1 1.9575799317,575799317,7,575799317, and 300 x 2050 show emissions and emissions reductions starting in 2010 through 2125. Historical emissions through 2020 are included in the pathway 300 x 2050.
The 300 x 2050 pathway removed roughly 237.85 GtC or 871.48 GtCO2 for fossil fuel emissions by 2050, and 71.44 GtC or 261.76 GtCO2 of Land-use change emissions by 2050. The pathway then continues on to remove all anthropogenic fossil fuel emissions totaling 481.90 GtC or 1765.7 GtCO2 by 2100. It also removes all anthropogenic land-use change emissions totaling 162.16 GtC or 594.16 GtCO2 by 2100.
As shown in Figure 2, the descent from peak emissions in the early 2020s is swiftly followed by net-zero in the mid-2020s (shown when the 300 x 2050 pathway crosses zero by late 2023), then steeper cuts of negative emissions are increased until 2030, when the yearly rate of negative emissions of Fossil Fuel emission added to AFOLU reach a total of 47 GtCO2 yr-1 by 2030 continuing on until 2050, then lowered to total to 25.03 GtCO2 yr-1 until 2100.
These types of removals, when run in the calibrated model, resulted in the following declines in global temperature, radiative forcing, CO2-eq concentration, and CO2 concentration. Listed for comparison is the marker SSPs for the SSP 1 storyline of high development of green-growth are IMAGE SSP1 2.6575799317,575799317 and IMAGE SSP 1 1.9575799317,575799317,575799317,575799317; SSP data from the IIASA Explorer575799317.
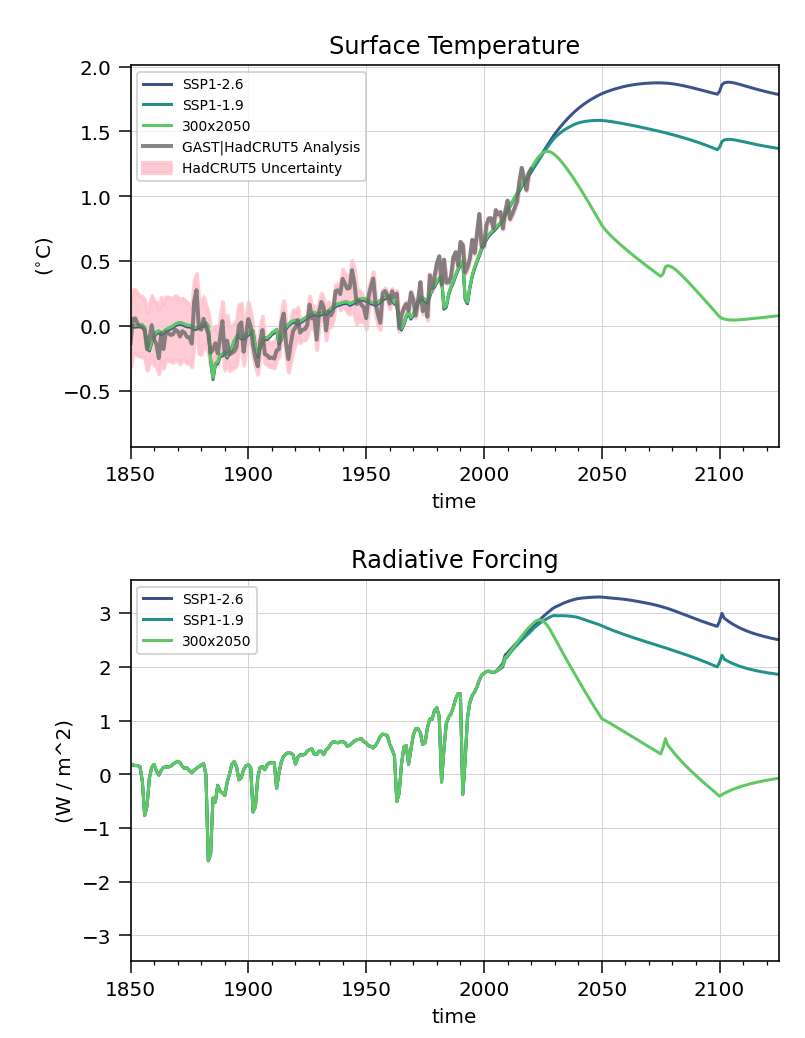
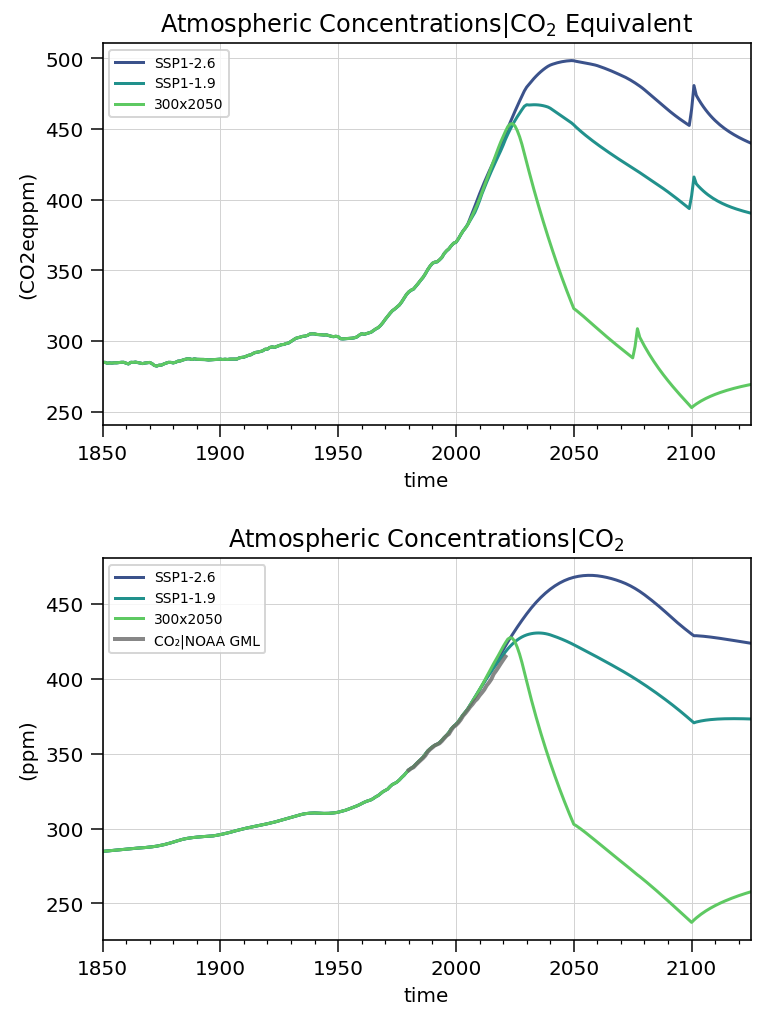
Figure 3 (a-d): Surface Temperature, Radiative Forcing, CO2-eq, and CO2 for the experimental 300 x 2050, SSP1 2.6 and SSP1 1.9 over the time 1850-2125, also shown in gray are the observational proxies of HadCRUT5 Analysis10 and the Keeling Curve11.
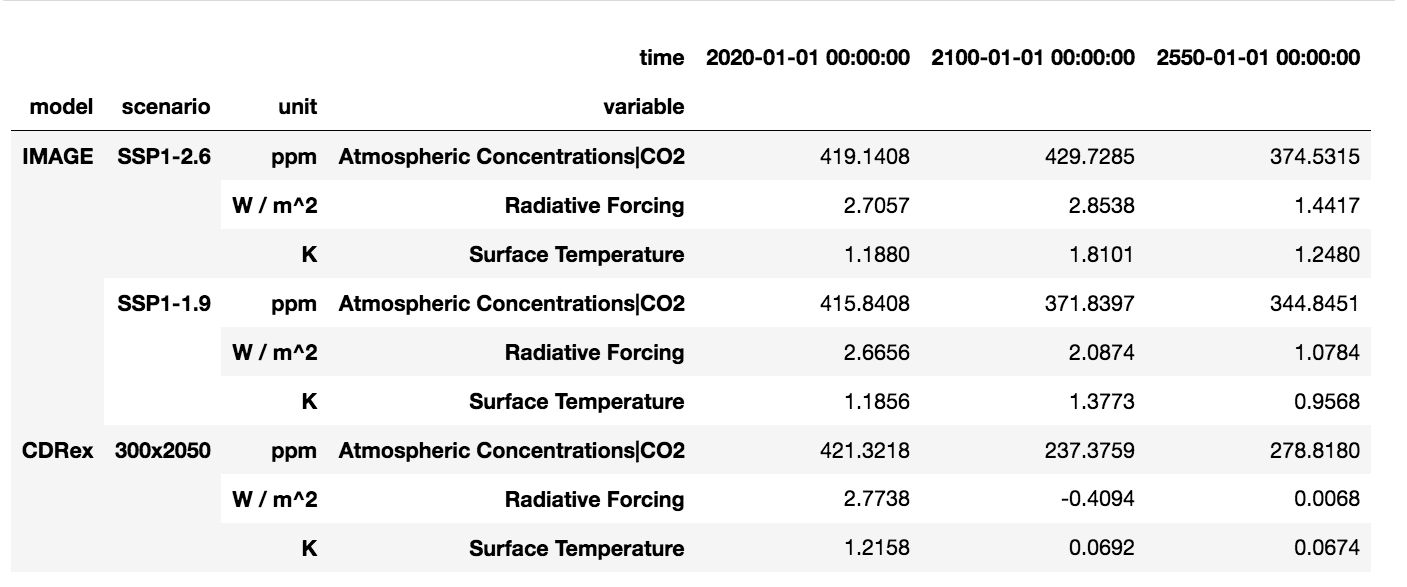
Table 2: CO2 concentration, Radiative Forcing, and Temperature.
Methods
Experiment Settings
The experiment was set up by calibrating and tuning MAGICC to better match present near-term temperature, concentration, and emissions data. The recent current anthropogenic carbon dioxide emissions data through 2020 from the Global Carbon Budget (2021)9 was used to calibrate and extend the carbon dioxide emissions data from 2009 to 2020 (estimated) and coupled to the removal pathway allowing for a closer near-term fit for peak CO2 concentration and temperature. To emulate CMIP and present-day temperature evolution in MAGICC, the HadCRUT5 (2020)575799317 temperature data analysis was used to line-fit the average of the last five years. The carbon dioxide concentration from the Keeling Curve11 was used to roughly line fit 2015 and 2020 and establish error, which under the tuned model yielding +8 ppm above the CO2 concentration for 2020. These tunings were applied as MAGICC 6.8 was last harmonized with 2010 data.
Tuned Settings
The following settings were changed: climate sensitivity, ratio to land-ocean, heat exchange and amplification, north to south heat exchange, CO2 fertilization and year start, land sink pools and fluxes, and soil feedback factors to allow the model to better line fit the HadCRUT5575799317 temperature analysis, GCB 20219 emissions data, and Keeling Curve11. Given the tunings to the land sink pools and fluxes, to simplify curve fitting and minimize overfitting only the soil feedback was needed and the other land sink feedbacks were disabled.
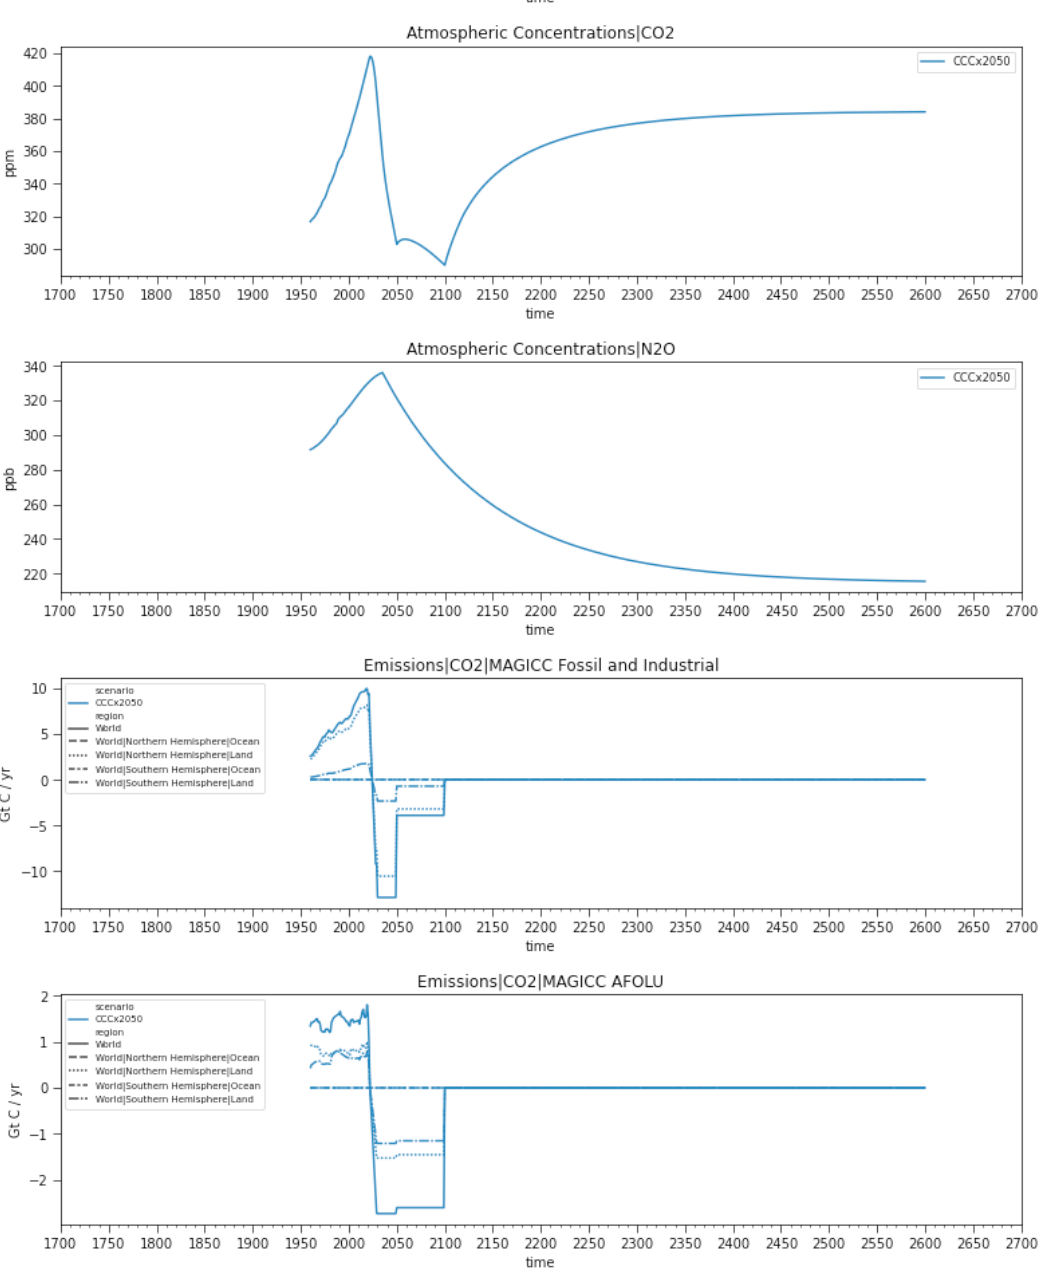
N2O data caused a noticeable spike artifact after severely decreasing emissions; MAGICC 6.8, which was finalized in 2012, does seem to artificially hold this value high for a few years after a large emissions reduction resulting in the artifact around the year 2079 for the 300 x 2050 pathway or in 2100 for the standard scenarios visible in the N2O, CO2-eq and Surface Temperature graphs. In order to smooth the declining curves for 300 x 2050, all GHGs were declined to phase out by 2079, except ammonia and the negative carbon dioxide (both fossil fuel and land-use change) emissions. It is left to further study under models not subject to this same N2O artifact if GHG phase-outs can happen closer to 2050 and would that lower the total number of removal necessary to reach 0ºC.
See the Supplemental Data section of the Supplementary Information for a listing of all tuned MAGICC configuration settings.
Preindustrial Baseline, 1720-1800
A baseline of 1720-1800 was chosen per Estimating Changes in Global Temperature since the Preindustrial Period, 201722 as mentioned in Trajectories of the Earth System in the Anthropocene, 201827 which resulted in temperatures 0.073ºC warmer than the 1850-1900 baseline.
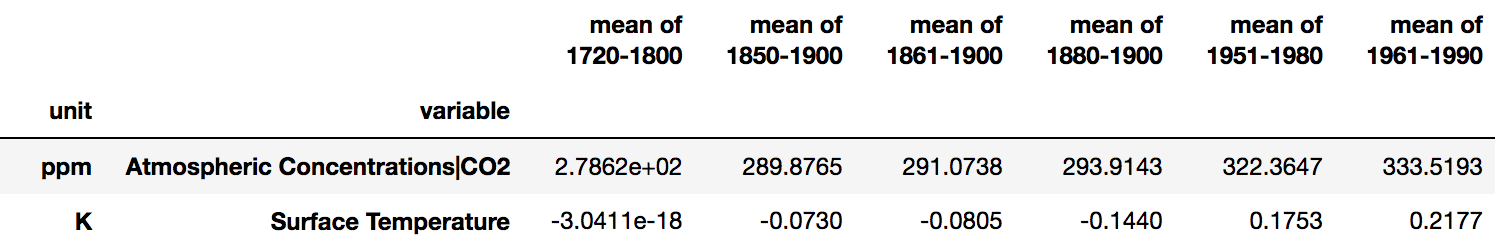
Table 4: CO2 concentration and temperature means for common various year spans.
The earlier baseline choice also avoids hysteresis seen if the model time series start is after 1765. A post-1765 start never reached a temperature of about 0ºC by 2500. Additional details are in the Supplemental Data section.
Discussion
Model Temperature Calibration
When calibrating for the Northern and Southern regions for the HadCRUT5 analysis, the model evolved the northern hemisphere and southern hemisphere Ocean, and hemisphere respective land binning. The model was calibrated to achieve a delta of +.0009ºC for the world and a little over ±0.18ºC for the northern hemisphere and the southern hemisphere. See Supplement Data Table 3 for temperature data in tabular form. The calibration to recent temperature forcing and recent emissions as of 2020, to match the final temperature and changed the amplitude of the temperature graphs over an untuned configuration. The calibration exercise additionally line fit global CO2 concentration for 2020 in an attempt to reach 412.44 ppm and match CO2 concentration per Dlugokencky, et. al (2021)11. The experimental pathway 300 x 2050 for 2000-2020 reflects a closer match to the temperature and CO2 evolution for near future dates, i.e., the 300 x 2050 pathway 2021 was predicted to reach 1.25ºC and a CO2 concentration of 423.97±8 ppm. This is visually noticeable (see figure 2) by the divergence of 300 x 2050 from the harmonized SSP1 2.6 and SSP1 1.9 starting about 2015. For an accounting of real-life emissions and temperature modeling, calibrating to the latest emissions, recent historical temperature, and CO2 concentration data is highly recommended.
Calibration and Regionality
By combining the HadCRUT5 calibration for the world, the regions split between hemispheres and the CRUTEM5 land dataset575799317 MAGICC predicts a temperature evolution lower than the mean of 2015-2020 in CRUTEM5 by 0.15ºC. The northern hemisphere, with the most developed land, experiences the majority of the warming well beyond the other regions, then southern hemisphere land is followed by the northern hemisphere ocean, and finally the southern hemisphere ocean. This ordering is common to all graphed pathways. The regional splitting of these temperature projections has only been compared but not tuned to the CRUTEM5 2021 dataset and not to other ESM data. The northern hemisphere mean temperature for 2015-2020 relative to 1850-1900 for 300 x 2050 pathway in MAGICC was 1.64ºC and 0.14ºC less than the CRUTEM5 2021 dataset mean (1.78ºC) over the same duration. The southern hemisphere mean temperature for 2015-2020 relative to 1850-1900 for 300 x 2050 pathway in MAGICC was 1.21ºC and 0.15ºC less than the CRUTEM5 2021 dataset means for 2015-2020 relative to 1857-1900 (1.361ºC).
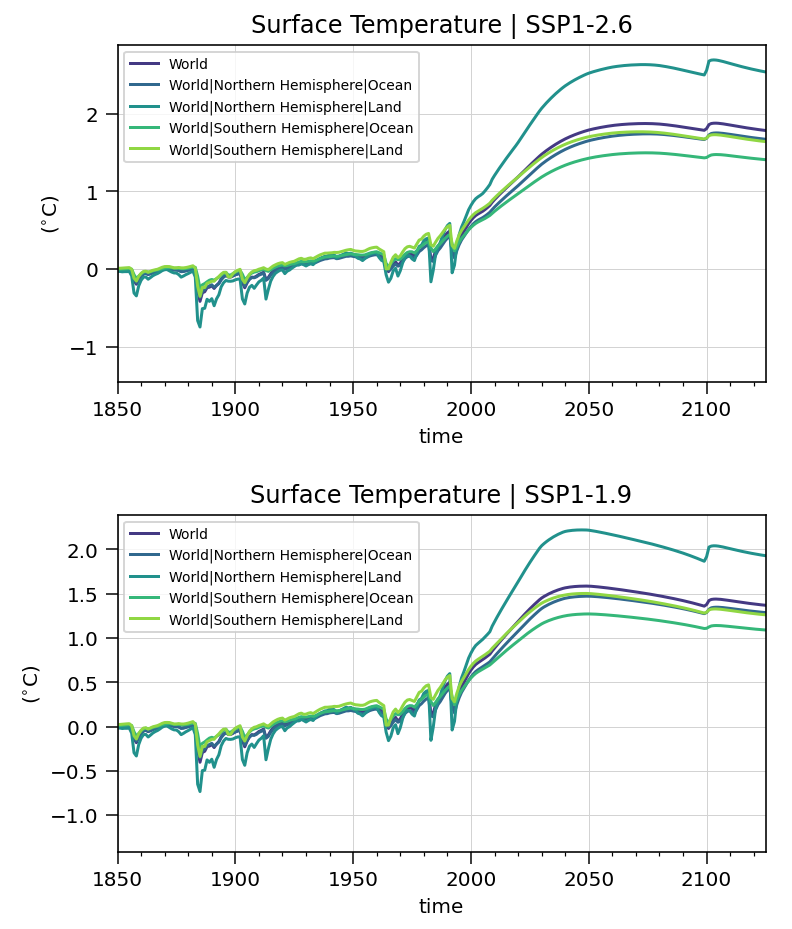
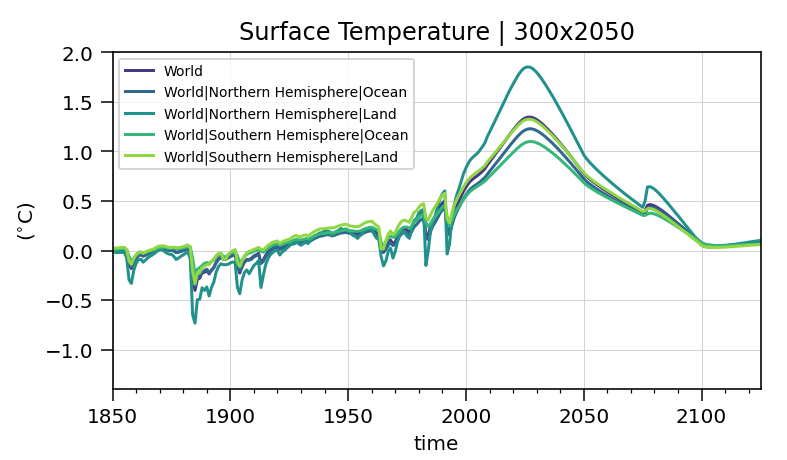
Figure 4 (a-c): Surface Temperature for SSP 1 2.6, SSP 1 1.9, and 300 x 2050 listing the northern, southern, land, and ocean regions, including the world region.
Given the effect of heat exchange and temperature splitting per region, and even if the temperature evolution for the 300 x 2050 pathway is estimated with high uncertainty and given how long it takes to recover with a high rate of removal, it follows that these next two decades are critical to lowering global temperatures.
Equilibrium Climate Sensitivity, Transient Climate Response, and Transient Response to Cumulative CO2 Emissions
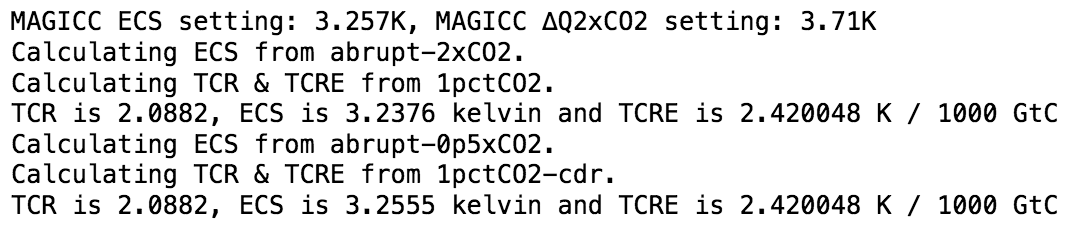
Figure 5: MAGICC output listing ECS, TCR, TCRE results, and CMIP6 experiments
The Equilibrium Climate Sensitivity (ECS) is defined by a doubling or halving of CO2 concentration over the time it takes for the global temperature to equilibrate. The MAGICC setting for core climate sensitivity (∆T2x) was raised from the MAGICC 6.801575799317,575799317 initial defaults of 3K to 3.257K and evolved ECS to 3.24+0.02K over 2500 years, in relation to the heat exchange tunings to allow for a closer proximal distribution to the hemisphere land regions when considering the CRUTEM5 2021 data and HadCRUT5 2020 data analysis. The effect of tuning to the present-day temperature mean also lowered both the Transient Response to Cumulative CO2 Emissions (TCRE) to 2.4K and the Transient Climate Response (TCR) to 2.1K. Despite present-day calibration temperature mean trending initially hotter than lower scenarios, SSP 1 2.6 and SSP 1 1.9, ECS didn't trend hotter. This effect is likely given the shorter duration of increased emissions from the least emitting pathway of 300 x 2050. See section 3.1 Introduction of variable climate sensitivities in Emulating coupled atmosphere-ocean and carbon cycle models with a simpler model, MAGICC6 – Part 1: Model description and calibration, 20112 for a more in-depth discussion as it pertains to the model emulator MAGICC 6.8x.
MAGICC 6.8 Negative Emissions Calibration
The negative emissions calibration of MAGICC 6.801 was performed by adapting the supplied pymagicc code to utilize the CMIP6 abrupt-0p5xCO212 and 1pctCO2-cdr test, then generate ECS, TCR, and TCRE by evaluating the abrupt doubling of emissions and the 1% continual increase in CO2 concentrations compared to the removal tests abrupt-0p5xCO2 and 1pctCO2-cdr tests. The calibration is valid if the absolute value of the paired tests and subsequent TCR, TCRE, and ECS are found to be equal. The absolute value of the pairs of the TCR and TCRE was equal, and ECS resulted in a slight difference of about 0.0194ºC and is still an acceptable demonstration of negative emissions given the tests equilibrate over 2500 years.
When removing all anthropogenic emissions from both fossil fuel emissions and land-use change with the 300 x 2050 pathway, the model was able to achieve 0.07ºC over the mean temperature for 1720-1800 or 0.13ºC over the mean temperature for 1850-1900. The inclusion of cumulative land-use change for removal was unexpected and unanticipated in the author's previous theory paper. See Supplemental Figures I-K for the tuned MAGICC 6.8 model output running abrupt-0p5xCO2 and comparison to a few abrupt-0p5xCO2 CMIP6 data 575799317,575799317,575799317,575799317,575799317,575799317,575799317,575799317,575799317.
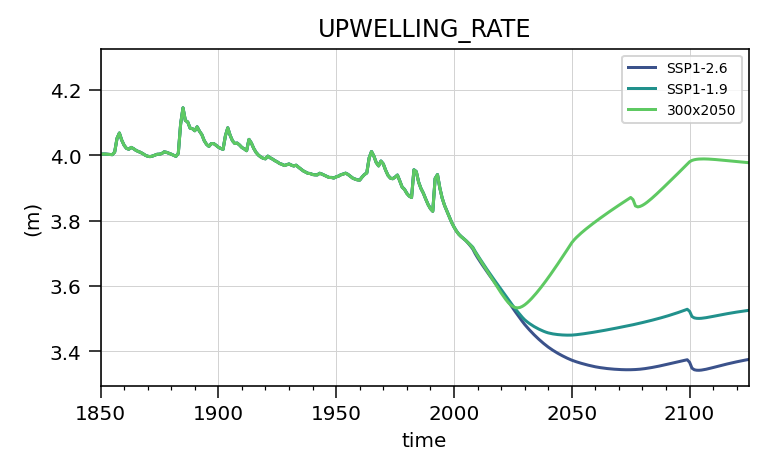
Ocean outgassing is inferred as all fossil fuel emissions had to be removed instead of only the emissions that currently reside in the atmosphere. A removal to roughly realize 302.83 ppm of CO2 by 2050 (237.85 GtC modeled, compared to (415 ppm - 302.83 ppm) * 2.124 (GtC/ppm) = 238.27 GtC), needed additional removal of 244 GtC to counterbalance the effect of the ocean reestablishing pCO2 equilibrium (resulted in outgassing), all of which was completed by 2100. The continued removal allowed both temperature and CO2 to slowly recover and finally converge to match pre-industrial. CO2 concentration does drop well below 237 ppm; however, CO2eq only drops below 252.99 ppm, all the while, the global temperature mean never goes lower than 0.04ºC. Ocean upwelling is predicted to return to baseline by 2100 in the 300 x 2050 pathway, see supplemental figure h. The ocean heat exchange, drop in concentration from emissions forcings, N2O artifact and GHGs phaseouts introduce enough varying factors to complicate modeling on a reduced complexity model software to merit a more comprehensive understanding of the present-day emissions and temperatures and future evolution of the experiments to be modeled in a full ESM ensemble.
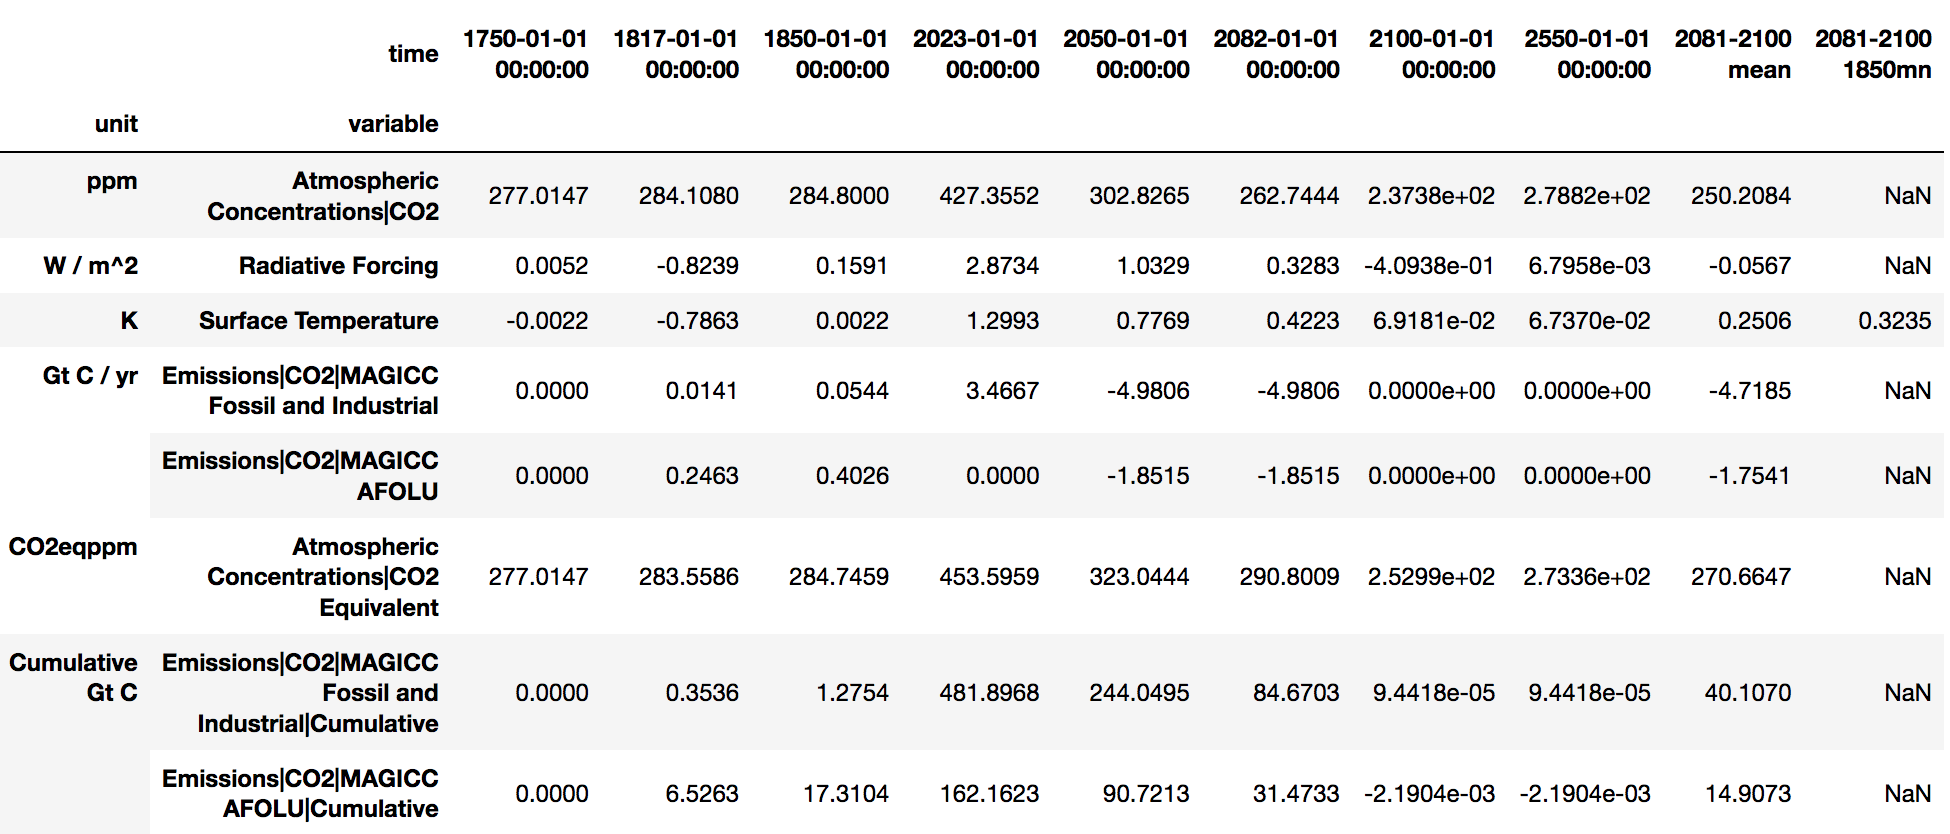
Table 6: 300 x 2050 CDR pathway data at various time points.
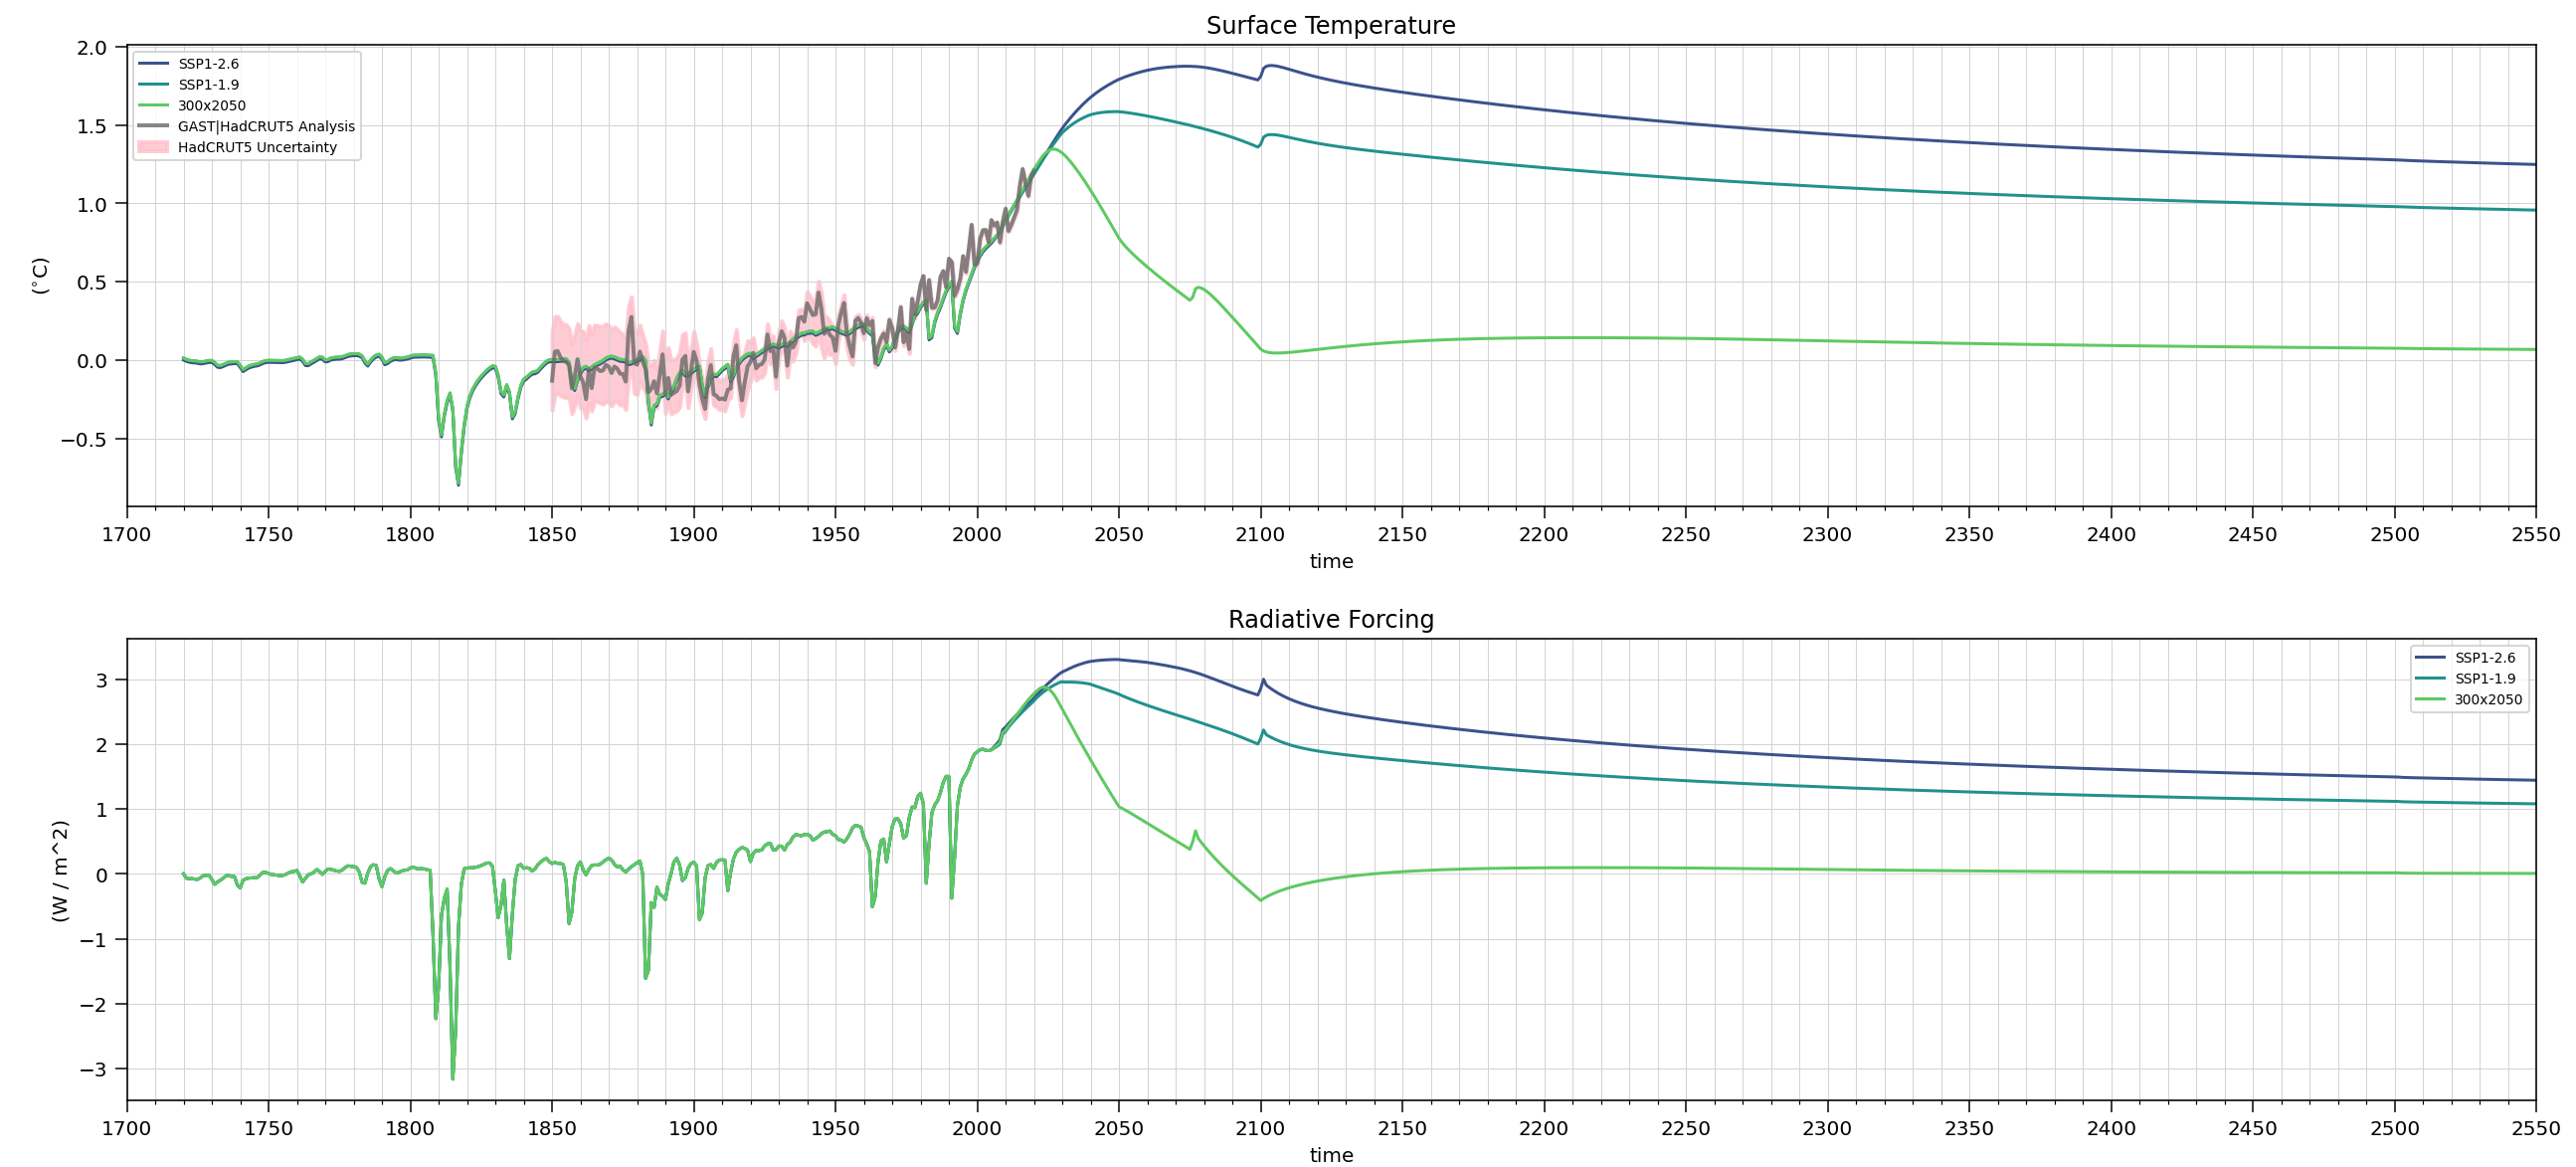
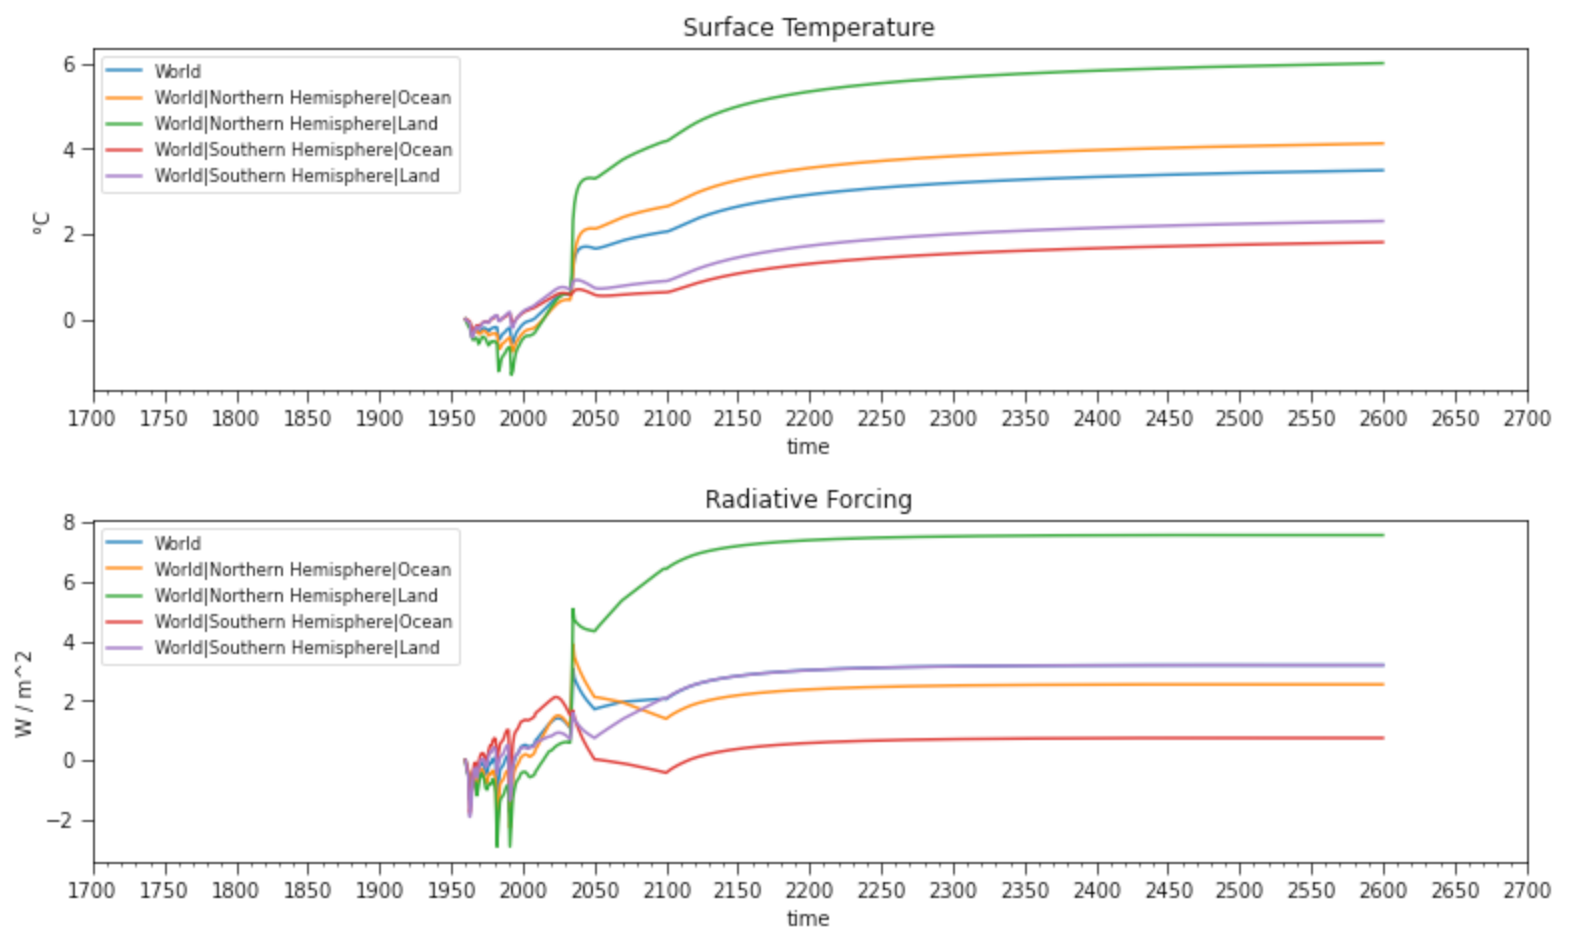
Figure 6 (a-b): Full graphs for Surface Temperature of 300 x 2050 and Radiative Forcing to show 300 x 2050 convergence of about 0.05ºC and Radiative Forcing 0.
Accounting of Land Use Change Emissions
With the inclusion of the Global Carbon Budget 2020 emissions data, the land-use change emissions forcings diverged from SSP 1 1.9 prior to 2020, as shown in figure 7, d. The divergence was unexpected as all emissions data ought to be harmonized by the model to 2005. To work around this behavior, extensive tunings to the heat, hemispheres and soil feedback were applied in addition to removing 42.4 GtC of AFOLU (Land-use change carbon) to match the MAGICC evolved emissions data. The soil carbon feedback was enabled and tuned to allow for positive growth in CO2 concentration to allow for minimal non-linear evolution to concentration and temperature in the near term mid-2020s, 2100, and beyond through 2550. The combined effect of tunings and workaround additionally increased the Northern/Southern temperature spread.
Given the mixed effects on the land sinks in the ESM results in Is there warming in the pipeline? A multi-model analysis of the Zero Emissions Commitment from CO2, 2020575799317, but yet slight decreases with the UVIC ESM in Asymmetry in the climate-carbon cycle response to positive and negative CO2 emissions, 2021575799317 a very slight rise (0.0674ºC) above 0ºC relative to 1720-1800 was chosen for the post-2100 temperature calibration. This temperature target remained slight to properly model negative emissions.
The author was unable to find guidance on increasing the land sink or a MAGICC 6.8 setting to allow more below ground mineralization of anthropogenic land-use change CO2 to remove it from the climate-carbon cycle and ocean or atmosphere sinks. The author doesn't know if there should be a portion of the cumulative land-use emissions that should have turned over to durable storage of CO2 in a mineralized form. It was suspected and thus written as such in the theory paper29 that land-use change emissions shouldn't need to be removed as they are fully in balance as it were, with the cumulative increases to the land sink since preindustrial. In lack of evidence, this seems in error. However, natural conversion to more permanent storage is a topic open to investigation.
|
|
|
|
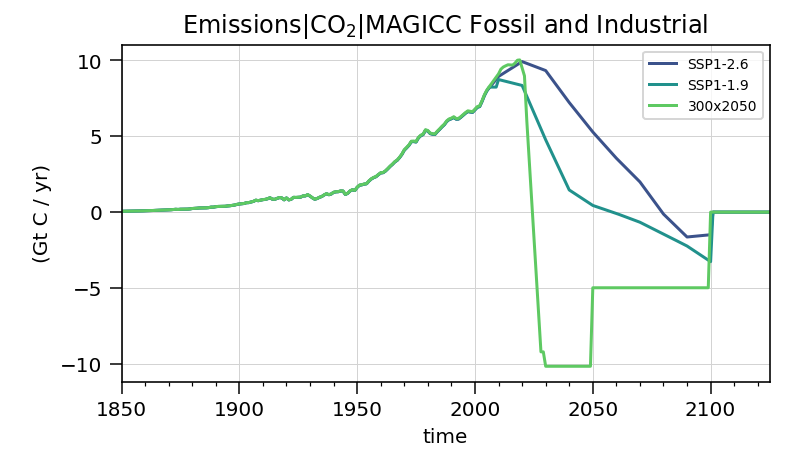
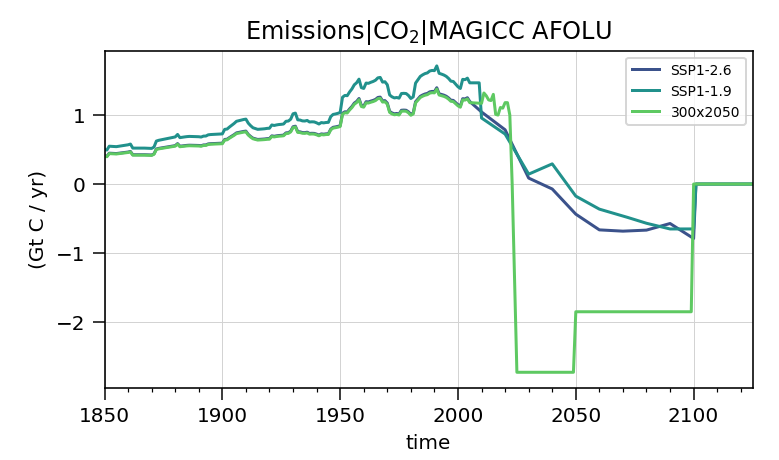
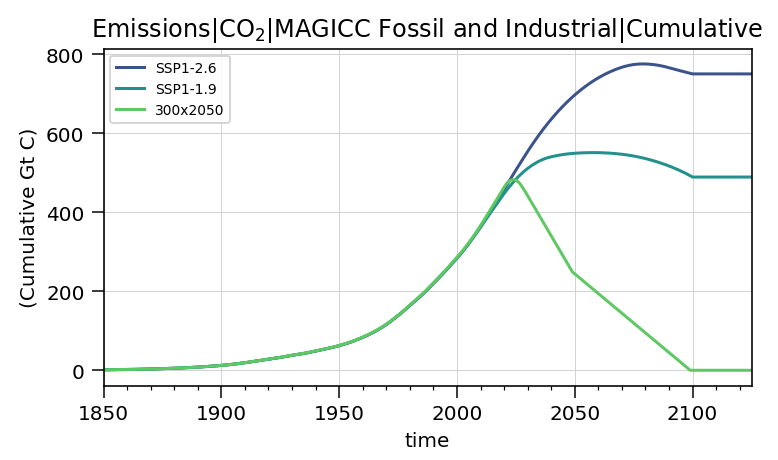
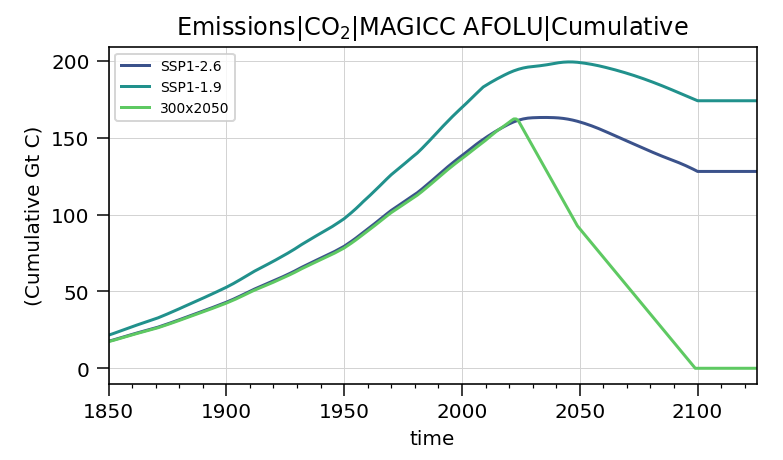
Figure 7 (a-d): Anthropogenic and Land-Use Change Emissions and cumulative emissions data, and CDR decreasing in green.
Negative Emissions Calibration and Negative Emissions Asymmetry
The 300 x 2050 pathway experiment has a total removal of 644.99+42.2 GtC in negative emissions to match the cumulative total of anthropogenic emissions. If more land-use change emissions were more permanently contained within the land sink whereby the quantity of negative emissions needed was reduced to about 500GtC, then the removal is within the model ensemble variability of AOGCM model and natural sink uptake studies 575799317,575799317,575799317. If all anthropogenic negative emissions since preindustrial 644.99+42.2 GtC or totaling 2520.4 GtCO2 are needed to reach closer to 0ºC over preindustrial, then it's likely that a small quantity more than what was emitted since preindustrial be added this experiment's modeled removal of all of anthropogenic. The magnitude over 500GtC to determine the magnitude of CDR necessary to match pre-industrial temperatures to be completed by 2100 is open for in-depth investigation.
Experimental Temperature Evolution over Model Time Bounds
If negative emissions have a nearly symmetrical climate-carbon cycle response 24 extending the experiment 300 x 2050 out to the model limits will evolve an eventual convergence to about 0.06ºC. The shading indicates the experiment run with a lower ECS of 2.1ºC and a higher ECS of 4.4ºC and includes the medium uncertainty region splitting. Given the vast quantity of emissions needed to be removed under such a short time period, it radically limits the amount of near-term emissions allowable and likely is only achievable should we limit emissions to stay well within the carbon budget. A continued dependency on fossil fuels is unable to yield phase-outs in emissions or the deep removals necessary to achieve the scale and scope to match the pre-industrial temperature.
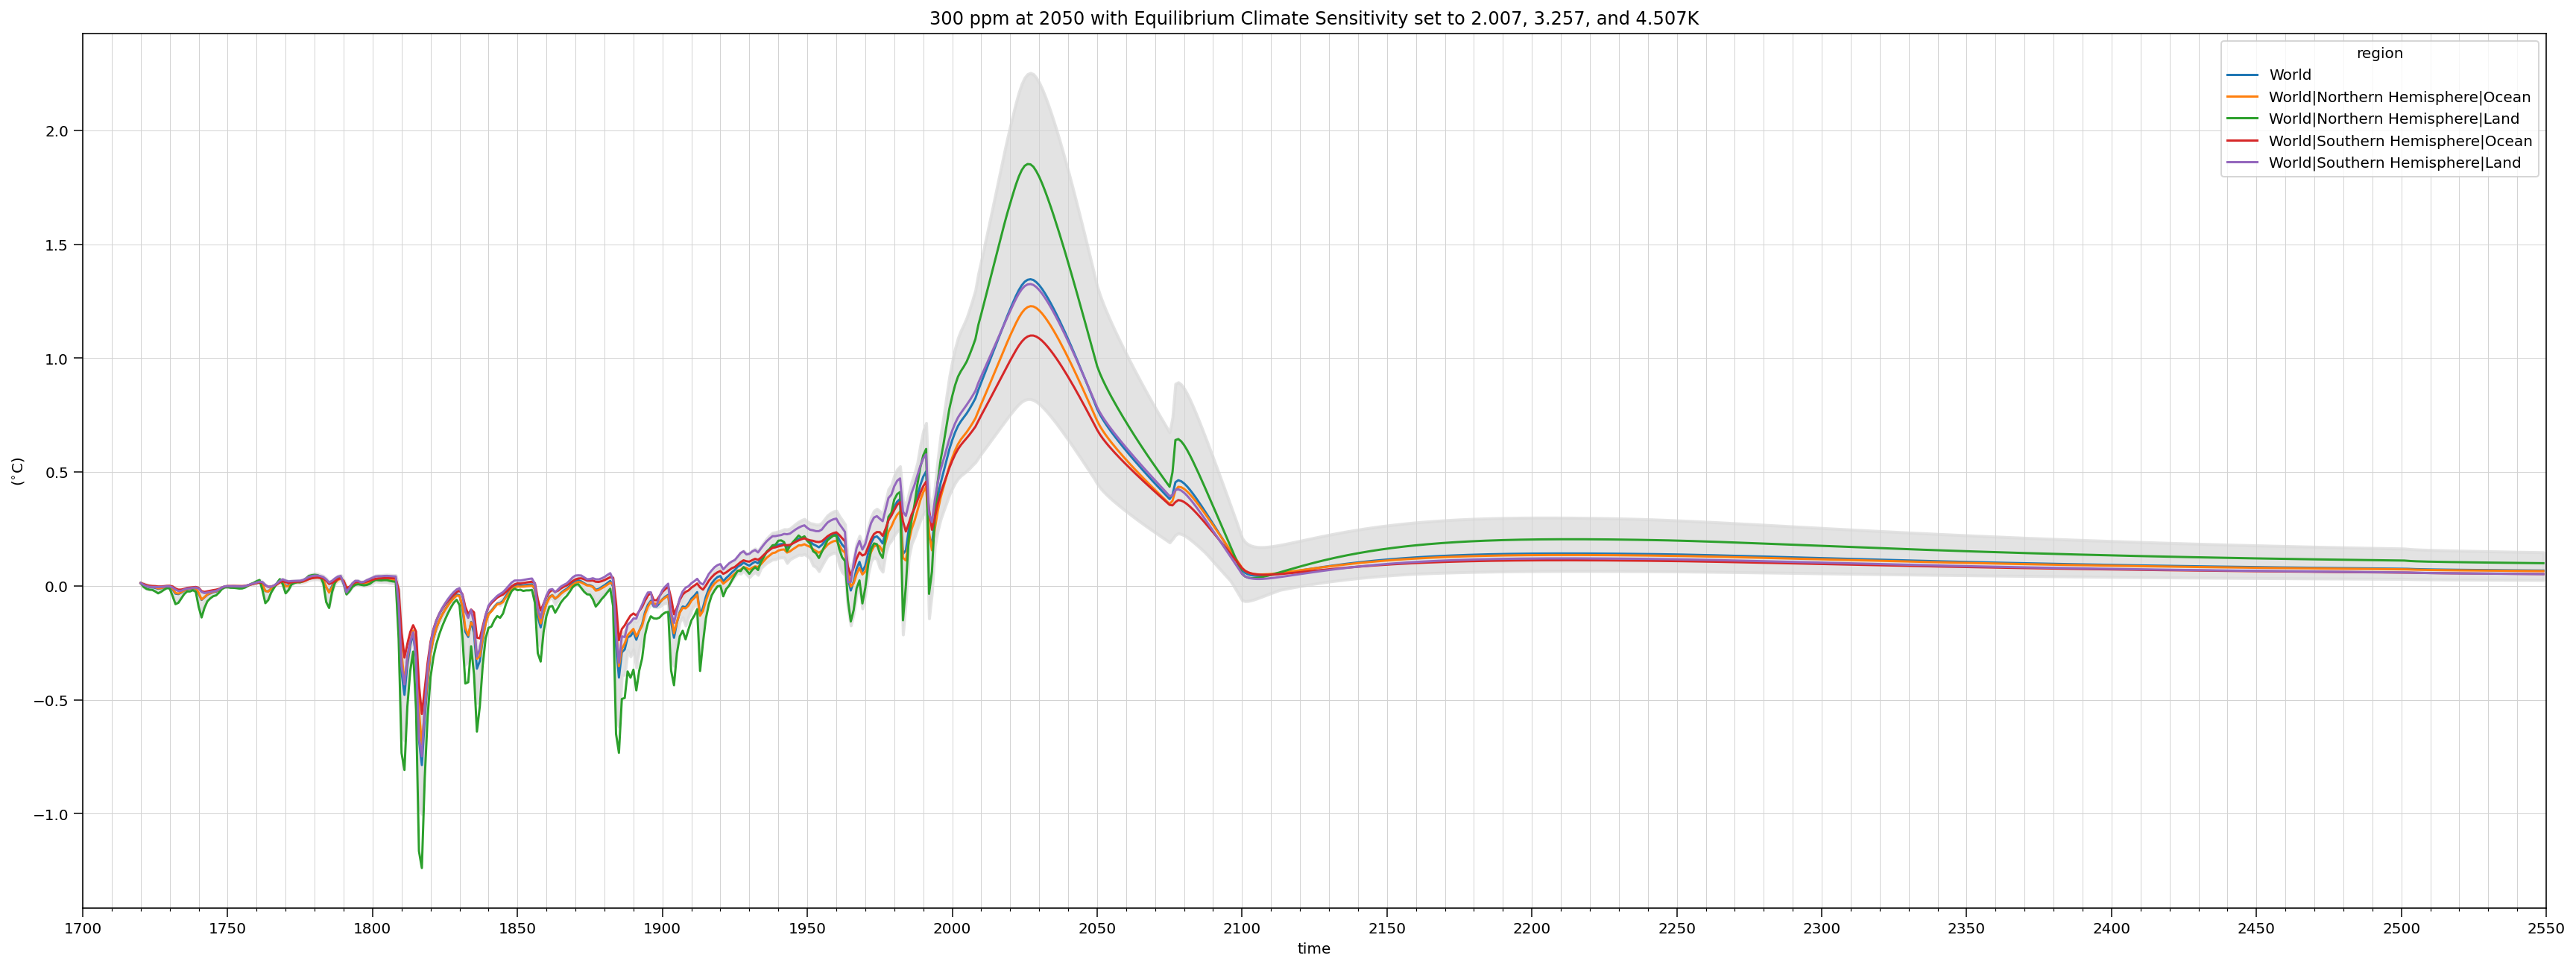
Figure 8: 300 x 2050 pathway with various Equilibrium Climate Sensitivities: 2.1K, 3.3K, and 4.4K from 1720 to 2550 relative to the mean of 1720-1800.
Conclusion
This text outlines starting points for future investigation on pathways that closely match pre-industrial over existing literature. Having a team explore the experiment's thesis of 1.6x preindustrial concentration 575799317 driven from forcings from emissions, and removing upwards of 600GtC (or 2198.4GtCO2), run with current temperature forcings, and run on a comprehensive model ensemble would best provide more accurate reflections of temperature, holding below 1.5ºC, and additional data such as the sea-level rise and AMOC, ENSO, jetstream turnover 575799317 and evolution over time.
The possibility of being able to eventually match the pre-industrial climate should help to inform the debate to radically accelerate front-loaded, near-term phase-out of anthropogenic emissions sources and scale zero-carbon intensity carbon removals in order to develop a more equal future world.
Data Availablity
2021 Code and Data Repository
The experimental data for 300 x 2050 is stored in the notebook within the Github repository. This data can be regenerated by downloading the repository and possibly installing wine if on non-windows application binary based platform, i.e., Linux, MacOS, UNIX, etc.
CDR Modeling Experiment Github repository: https://github.com/hsbay/cdrmex
Notebooks
- https://github.com/hsbay/cdrmex/blob/main/ONCtests.ipynb
- https://github.com/hsbay/cdrmex/blob/main/cal-cmip6-abrupt0p5xCO2-ex.ipynb
Dependencies
MAGICC scenario SCEN input files, HadCRUT5 data: https://github.com/hsbay/cdrmex/tree/main/SCEN
Python utility helper: https://github.com/hsbay/cdrmex/blob/main/utils.py
wine - Wine Is Not an Emulator, emulation software for running Windows programs on Linux and Unixes, including MacOS
Pymagicc will install the following: MAGICC 6.801 and jupyter
SSP Database, International Institute for Applied Systems Analysis: https://tntcat.iiasa.ac.at/SspDb, About page
Supplemental Data
Alternative figures demonstrating anomalies and other diagnostic information.
The yearly negative emission rates are in the table below:
| unit | variable | 2019 | 2029 | 2030 | 2050 |
|---|---|---|---|---|---|
| GtC/yr | Emissions|CO2|MAGICC Fossil and Industrial | 10.02 | -9.2 | -10.15 | -4.98 |
| GtCO2/yr | Emissions|CO2|MAGICC AFOLU | 1.10 | -2.73 | -2.73 | -1.85 |
| Emissions|CO2|MAGICC Fossil and Industrial | 36.71 | -33.71 | -37.19 | -18.25 | |
| Emissions|CO2|MAGICC AFOLU | 4.03 | -10.00 | -10.00 | -6.78 |
Table 1: Yearly rates of negative emissions for 300 x 2050 experimental pathway.
Alternate figures showing model exceptions to input data. As MAGICC 6.8 was not previously calibrated for negative emissions, the negative emissions calibration is conditional that the series starts before 1766.
Figures a-d: Wide errors appear shortly after reaching large-scale negative emissions.
Figures e-f: When using MAGICC 6.8 with a starting point at 1950 irrespective of a baseline adjustment. The CDRMEx baseline adjustment code was completely removed during these experiments.
Figures g-h:
N2O concentration data.
Ocean Upwelling rate from upwelling-diffusion-entrainment (UDE) ocean model per MAGICC 6.8.
Figures i-m: Abrupt0p5CO2 CMIP6 tuned MAGICC 6.8 output, CO2 concentration, Radiative Forcing, Surface Temperature, Inverse Emissions, and Upwelling Rate
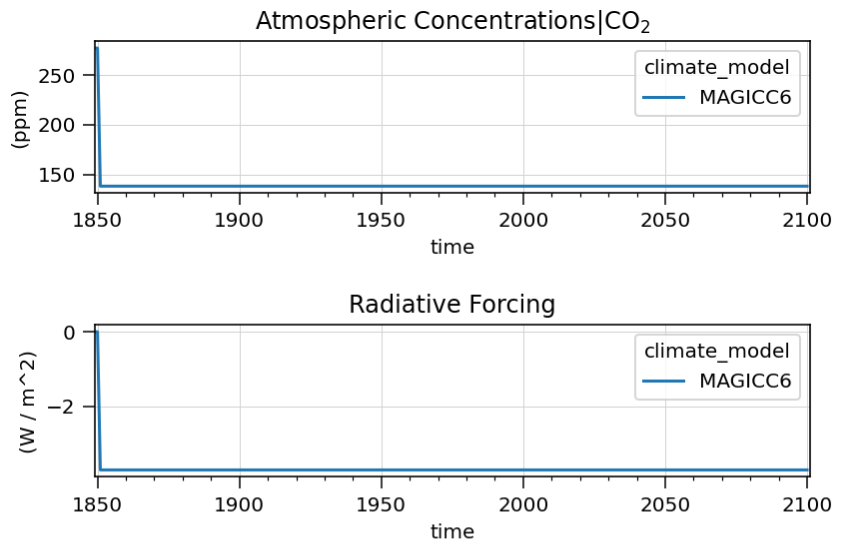
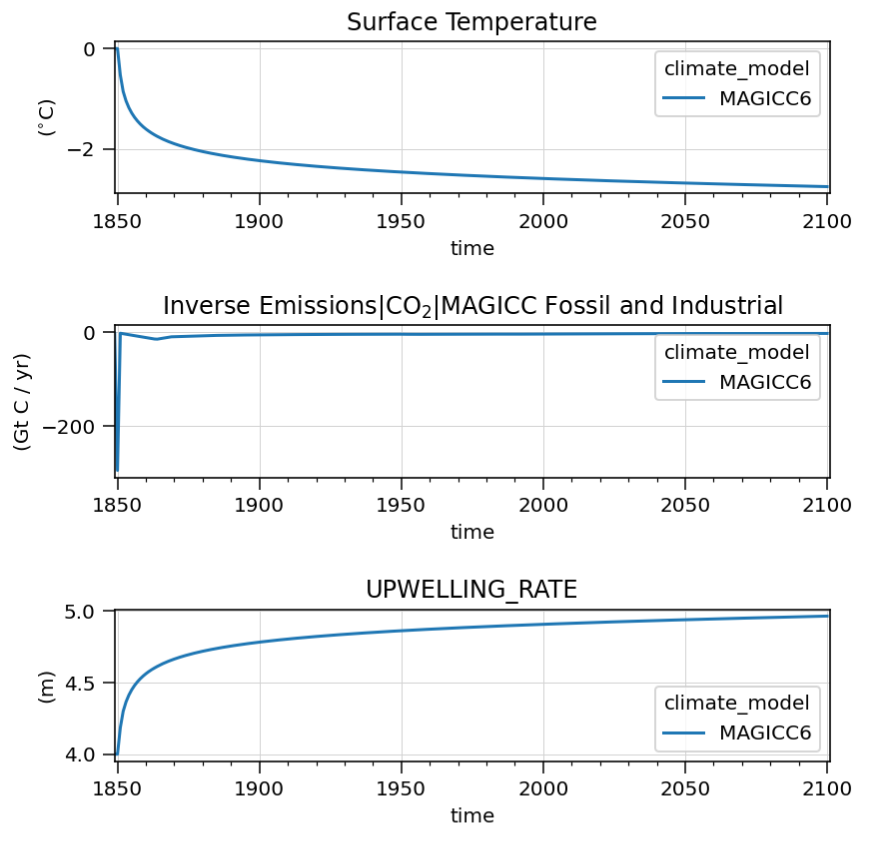
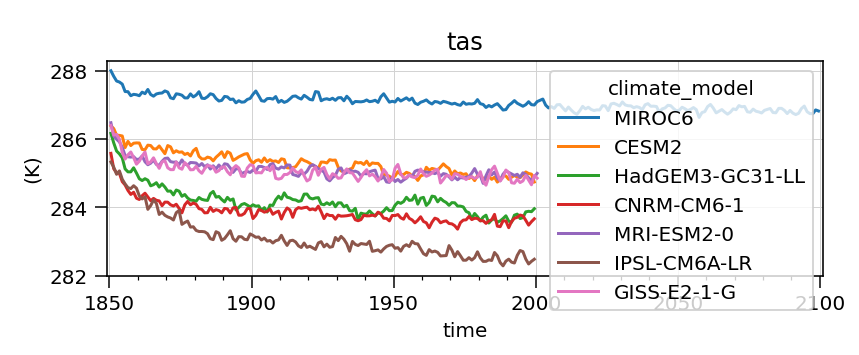
Figure n: Abrupt0p5CO2 CMIP6 comparison. MAGICC 6.8 would more closely match a 2.59ºC delta over 250 years and more similar to the HadGEM3-GC2l-LL (-2.21ºC, delta). If we adjusted MAGICC 6.8 to report Kelvin measured absolutely 286.86K (as 273.15 ºC to K + 14±.5ºC 28 - 0.289°C (HadCRUT5 mean 1961-1990) = 286.86±.5K).
Funding
Anonymous sponsor retired from semiconductor manufacturing, software entrepreneur, Timothee Besset, US economic stimulus. The funding goal has not been met, consider sponsoring: https://github.com/sponsors/safiume.
Competing Interests
None.
Acknowledgments
The pymagicc, MAGICC, and Global Carbon Budget have been instrumental in writing this letter. Shannon thanks the authors of the GCB, HadCRUT5, MAGICC, pymagicc, Scripps, Mauna Loa, NSF, CMIP, and IPCC scientists. Shannon additionally thanks Peter Fiekowsky, Foundation for Climate Restoration, and Timothee Basset.
References
| Anchor | ||||
|---|---|---|---|---|
|
| Anchor | ||||
|---|---|---|---|---|
|
Emulating atmosphere-ocean and carbon cycle models with a simpler model, MAGICC6 – Part 2: Applications, 2011, Meinshausen, M., Wigley, T. M. L., and Raper, S. C. B., Atmos. Chem. Phys.,11, 1457–1471, DOI: 10.5194/acp-11-1457-2011Anchor 3 3
| Anchor | ||||
|---|---|---|---|---|
|
| Anchor | ||||
|---|---|---|---|---|
|
| Anchor | ||||
|---|---|---|---|---|
|
| Anchor | ||||
|---|---|---|---|---|
|
| Anchor | ||||
|---|---|---|---|---|
|
| Anchor | ||||
|---|---|---|---|---|
|
| Anchor | ||||
|---|---|---|---|---|
|
| Anchor | ||||
|---|---|---|---|---|
|
| Anchor | ||||
|---|---|---|---|---|
|
| Anchor | ||||
|---|---|---|---|---|
|
| Anchor | ||||
|---|---|---|---|---|
|
| Anchor | ||||
|---|---|---|---|---|
|
| Anchor | ||||
|---|---|---|---|---|
|
| Anchor | ||||
|---|---|---|---|---|
|
http://cera-www.dkrz.de/WDCC/meta/CMIP6/CMIP6.CFMIP.CNRM-CERFACS.CNRM-CM6-1.abrupt-0p5xCO2, Creative Commons Attribution Non Commercial Share Alike 4.0 International
| Anchor | ||||
|---|---|---|---|---|
|
| Anchor | ||||
|---|---|---|---|---|
|
| Anchor | ||||
|---|---|---|---|---|
|
http://cera-www.dkrz.de/WDCC/meta/CMIP6/CMIP6.CFMIP.MOHC.HadGEM3-GC31-LL.abrupt-0p5xCO2, Creative Commons Attribution Share Alike 4.0 International
| Anchor | ||||
|---|---|---|---|---|
|
http://cera-www.dkrz.de/WDCC/meta/CMIP6/CMIP6.CFMIP.NCAR.CESM2.abrupt-0p5xCO2, Creative Commons Attribution Share Alike 4.0 International
| Anchor | ||||
|---|---|---|---|---|
|
| Anchor | ||||
|---|---|---|---|---|
|
| Anchor | ||||
|---|---|---|---|---|
|
| Anchor | ||||
|---|---|---|---|---|
|
| Anchor | ||||
|---|---|---|---|---|
|
| Anchor | ||||
|---|---|---|---|---|
|
| Anchor | ||||
|---|---|---|---|---|
|
| Anchor | ||||
|---|---|---|---|---|
|
Related References
Global Carbon Budget 2017, 2018, Le Quéré, C., Andrew, R. M., Friedlingstein, P., Sitch, S., Pongratz, J., Manning, A. C., Korsbakken, J. I., Peters, G. P., Canadell, J. G., Jackson, R. B., Boden, T. A., Tans, P. P., Andrews, O. D., Arora, V. K., Bakker, D. C. E., Barbero, L., Becker, M., Betts, R. A., Bopp, L., Chevallier, F., Chini, L. P., Ciais, P., Cosca, C. E., Cross, J., Currie, K., Gasser, T., Harris, I., Hauck, J., Haverd, V., Houghton, R. A., Hunt, C. W., Hurtt, G., Ilyina, T., Jain, A. K., Kato, E., Kautz, M., Keeling, R. F., Klein Goldewijk, K., Körtzinger, A., Landschützer, P., Lefèvre, N., Lenton, A., Lienert, S., Lima, I., Lombardozzi, D., Metzl, N., Millero, F., Monteiro, P. M. S., Munro, D. R., Nabel, J. E. M. S., Nakaoka, S.-I., Nojiri, Y., Padin, X. A., Peregon, A., Pfeil, B., Pierrot, D., Poulter, B., Rehder, G., Reimer, J., Rödenbeck, C., Schwinger, J., Séférian, R., Skjelvan, I., Stocker, B. D., Tian, H., Tilbrook, B., Tubiello, F. N., van der Laan-Luijkx, I. T., van der Werf, G. R., van Heuven, S., Viovy, N., Vuichard, N., Walker, A. P., Watson, A. J., Wiltshire, A. J., Zaehle, S., and Zhu, D., Earth System Science Data, 10, pp. 405-448, DOI: 10.5194/essd-10-405-2018
Target atmospheric CO2: Where should humanity aim?, 2008, Hansen, J., M. Sato, P. Kharecha, D. Beerling, R. Berner, V. Masson-Delmotte, M. Pagani, M. Raymo, D.L. Royer, and J.C. Zachos, Open Atmos. Sci. J., 2, 217-231, DOI: 10.2174/1874282300802010217
Data and Code Availablity
Google Drive files
Presented Paper: Targeting All Anthropogenic Carbon Dioxide Emissions
Poster Presentation: Poster Slides
- CDR modeled in MAGICC to return to preindustrial temperatures by 2100.
GitHub Repository