Table of Contents
| Table of Contents | ||||
|---|---|---|---|---|
|
| Page Properties | ||||||||||||||
|---|---|---|---|---|---|---|---|---|---|---|---|---|---|---|
|
Status
New draft is pending major bug fixes to land sink/land use change/NPP related settings causing heat imbalance from AFOLU emissions->concentrations-> to hold heat and raise final temperature beyond expectations. The time series evolutions fluctuate based on co2_tempfeedback_yrstart and co2_fertilization_yrstart time.
(setting *yrstart to 1960:)
And the final temperature still reads low whereas emissions and concentration seem slightly high in the near term.
Status Details
Expected results: The target range for SSP1-1.9 is 2081-2100 mean of 1.4ºC with a range of 1ºC to 1.8ºC per SPM Table 1, B1.2 AR 6 WG1, 2021
Native RCP3PD initial work by the IMAGE team had a median target of 1.6ºC in live.magicc.org running MAGICC 6.801
An archived screenshot of RCP3PD (which is pymagicc's actual series and later became the earlier versions of RCP2.6 by the IMAGE team.) 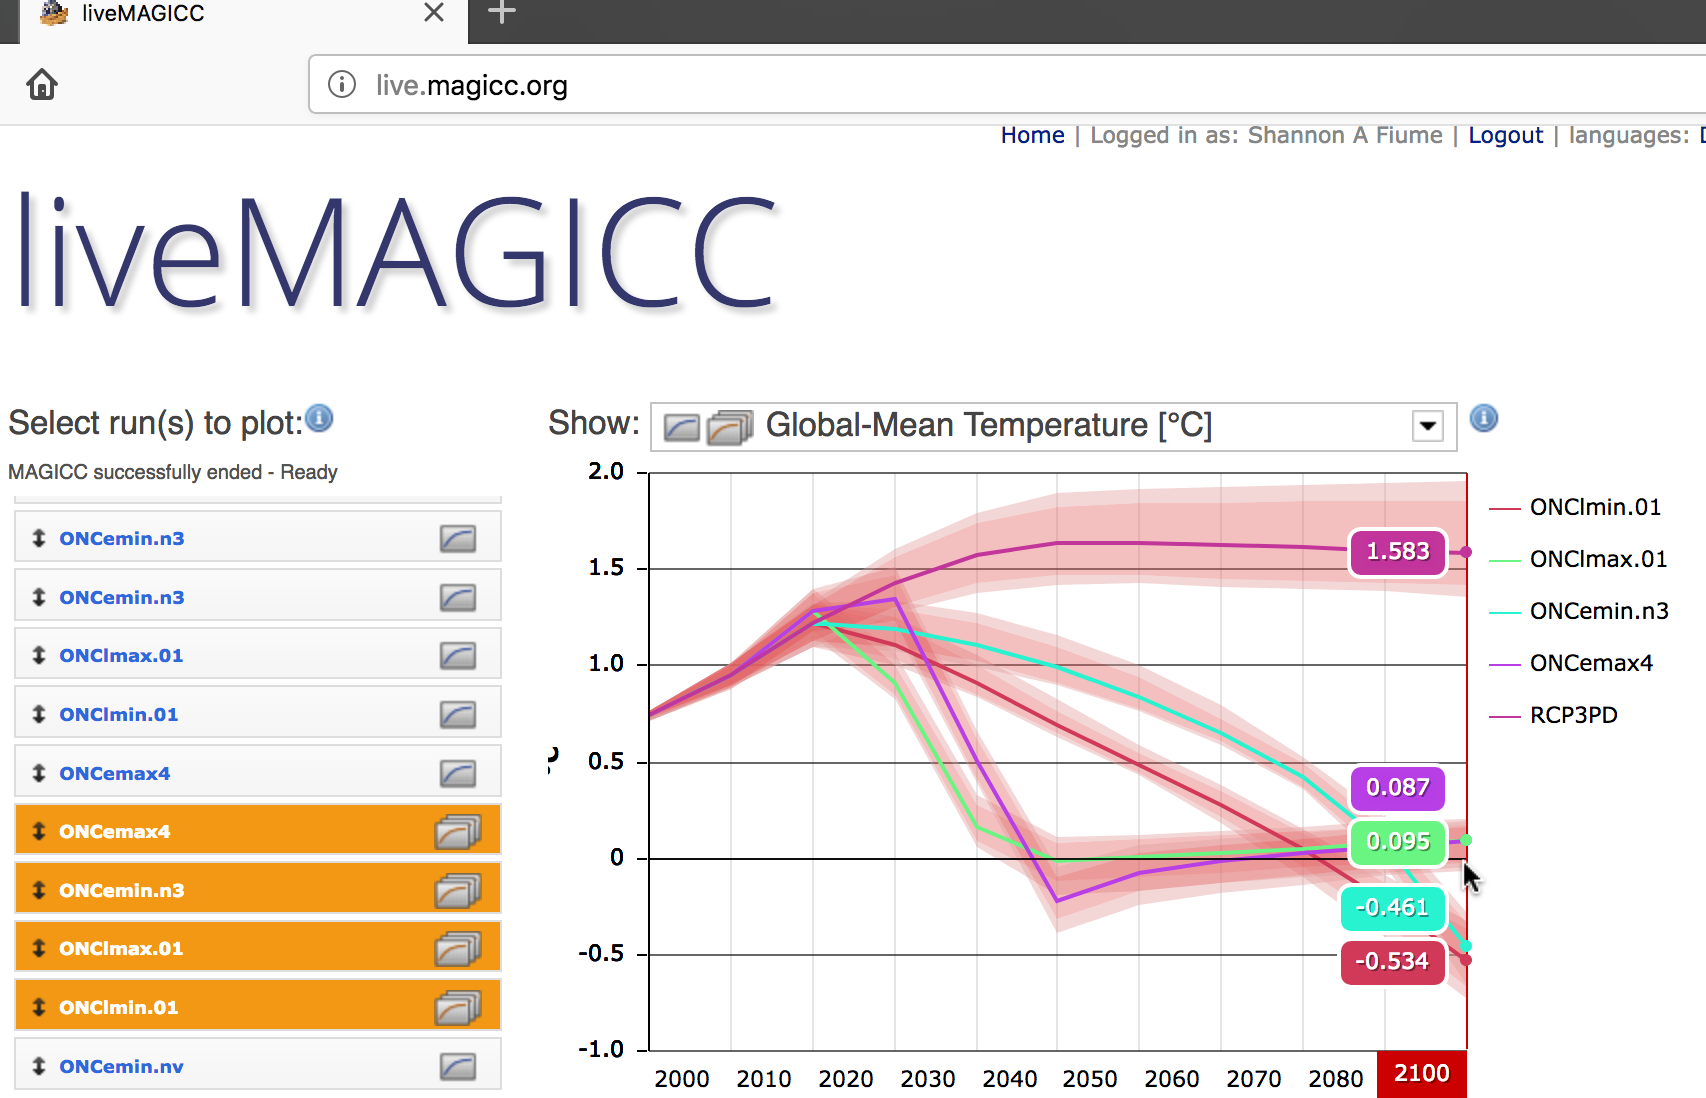 (July 5th 2018, unmodified live MAGICC settings.)
Global CO2 concentration for 2020 was 412.44 ppm, per: Dlugokencky, E., Tans, P., NOAA/GML, (2021), https://gml.noaa.gov/webdata/ccgg/trends/co2/co2_annmean_gl.txt
New work is under the ECS-heat exchange hotfix branch and will be merged after passing tests.
https://github.com/hsbay/cdrmex/blob/ecs-heatex-hotfix/ONCtests.ipynb
Errors:
Initial defaults when paired with GCB emissions through 2021, results in high CO2 concentration and lower overall surface temperature. Calibration is still in process.
The emissions series is calibrated to the calendar year to the historic emissions, yet the temperature series is calibrated to the previous yearly average. This discrepancy moves the temperature series lower and emissions higher than expected. Still determining if there are other errors in the experiment setup and rendering.
Removed data shifting to magic years +1 offset to match calendar year to better match sulfur data per:
Acceptable signal data should be from 1815-1818, with a midpoint of sulfur deposition about 18 months post-eruption equating to about October 1816 (±4 months). Sulfur data: https://doi.org/10.1029/2009GL040882. The sulfur data reconstruction correlates with the temperature reconstruction that 1816 was colder than 1817. https://doi.org/10.1038/s41467-017-01302-z. Local Central England temperature data from the MET lists a similar difference of 1816 colder than 1817 https://www.metoffice.gov.uk/hadobs/hadcet/cetml1659on.dat, NH, Central England, 1816 ≈ 8.38ºC, 1817 ≈ 9.04ºC (yearly mean recovery by 1817, colder than normal winter '17).
Current ECS 3.5ºC, and ∆Q_2x = 3.46 results in:

1817 seems too low. More testing/debugging ...
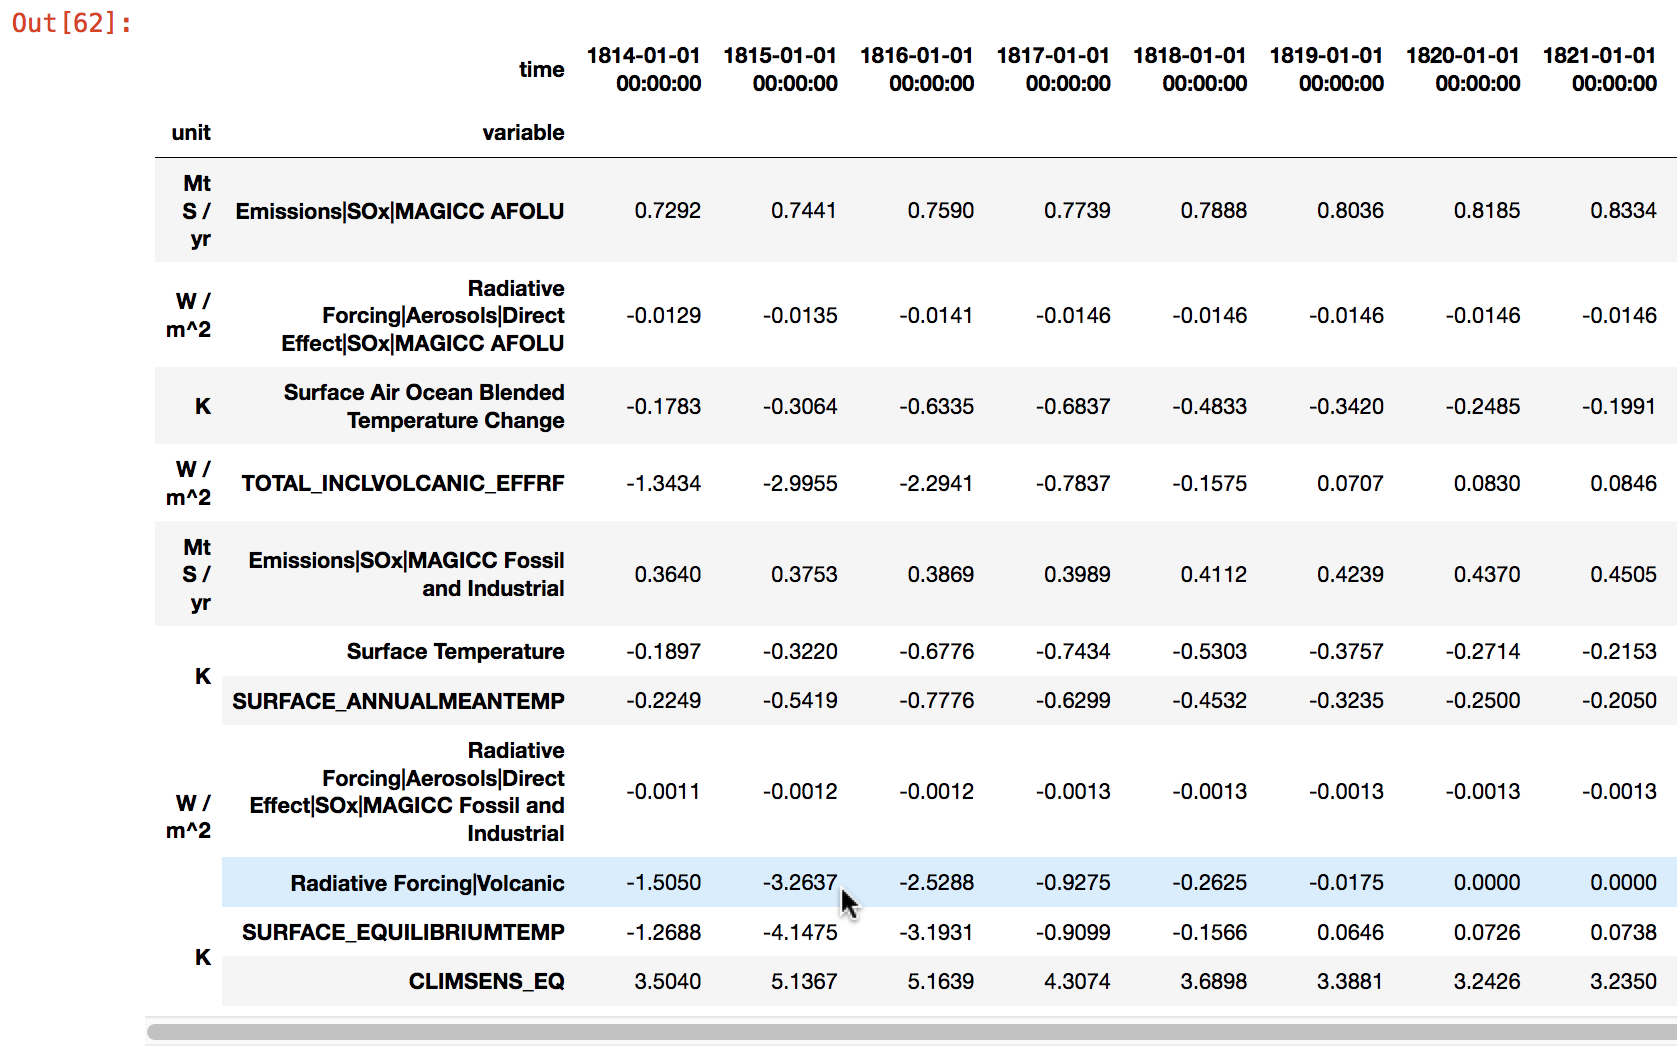
Volcanic RF has the correct calendar year matching MAGICC year. I'll revert back to internal MAGICC date spans, then tune the heat transfer out of the sinks so the temperature evolution more closely matches the last few yearsve updated the latest branch to use the native magicc/calendar year and removed all date shifting.
Description
Model large-scale carbon dioxide removals and greenhouse gas phase-outs to verify temperature achieving close to 0ºC over the mean global temperature of 1850-1900 by 2100.
This paper runs the experiments on the climate model emulator (or reduced complexity model) MAGICC 6.8 to provide rationale for further exploration within an Earth System Model (ESM) to better project the climate under strong feedbacks while realizing final temperature evolution to match pre-industrial.
While a full experimental paper would be highly informative when run on an ESM that captures a newer CDRMIP class Atmosphere-Ocean General Circulation Model (AOGCM) these resources are unavailable to ONC.
About These Papers
These papers were conceived by Shannon A. Fiume in Jan of 2018 as she was unable to find literature on a way to return to the preindustrial climate within 100 years of the present date while verifying how much carbon could be removed by scaled CDR in an exponential manner. By backtracking to the larger scoped question, if we were to target a lower temperature or preindustrial itself, this new goal could add an additional pathway to a more restored climate. Maybe this new goal could help limit damages by providing more literature for reducing emissions faster in the near term. Given the scientific gap, this project then shifted from a goal setting for ONC of what is the upper bound of carbon we ought to remove, to the larger question of how much carbon would humans need to remove or have completed by 2100 in order to shift the climate back as close as possible to 0ºC over pre-industrial. See Shannon Fiume's comments on the CDR mailing list and Twitter for her conversations with the CDR community.
These papers are still scoping exercises and technology-agnostic which aren't inherently classified under the category as presenting a Moral Hazard. To be more explicit, to achieve net zero the fastest, mitigate a high-risk climate, limit further ecological loss and damages, and prepare to scale (fossil fuel-less) negative emissions for the next 70 years, it's necessary to have fossil fuels phased out as soon as possible and are therefore inappropriate to be used as a scaled source to generate net-zero or net-negative emissions. We have too many cumulative emissions to remove, (think of running the carbon budget in reverse) to also be adding emissions in any sizeable quantity.
Papers
Theory paper
Presented version: Targeting All Anthropogenic Carbon Dioxide Emissions (2018)
PrePrint (non-peer-reviewed) Revised version: Alternative Method to Determine a Carbon Dioxide Removal Target (2018), https://doi.org/10.1002/essoar.10503117.1
Author: Shannon A. Fiume
Description: A short paper outlining how much carbon we need to solidify for complete climate restoration and the carbon's location. It shows why 300 ppm and less need to be fully explored for complete climate restoration.
Experimental Validation Paper
Experiments performed in collaboration with Foundation for Climate Restoration. The experiments to test how to achieve 300 ppm, then to 280 ppm.
Author: Shannon A. Fiume
Abstract
An experimental test of the theory proposed in an Alternative Method to Determine a Carbon Dioxide Removal Target. The multi-step experiment explores halting anthropogenic emissions from greenhouse gases and removing all historic cumulative anthropogenic carbon dioxide emissions in less than 100 years to match the preindustrial temperature. The multi-step experiment was conducted on MAGICC 6.8, a reduced complexity model or model emulator, managed by pymagicc. The experiment compares the new experimental pathway, RCP 2.6 and SSP1-1.19, and explores large-scale linear carbon dioxide removal over the 80-year time frame. The multi-step experiment calibrated the experimental pathway to include recent historic emissions through 2020 and calibrated the model to recent average global temperatures through 2020. Contrary to the proposed theory all anthropogenic emissions (from both fossil fuels and land-use change) needed to be removed to realize final temperatures close to 0ºC. The experimental pathway evolved temperature to 0.08ºC to 1850-1900 mean and CO2 concentration to 277.46 ppm by 2560. The experimental pathway achieved nearly 0ºC over 1850-1900 of warming at 2100 after phasing out all greenhouse gases, excluding ammonia and removing all cumulative anthropogenic carbon dioxide.
Results Summary
Current results are in the jupyter python pymagicc (2.0) ONC CDRMEx workbook running MAGICC 6.8: https://github.com/hsbay/cdrmex, https://github.com/hsbay/cdrmex/blob/main/ONCtests.ipynb
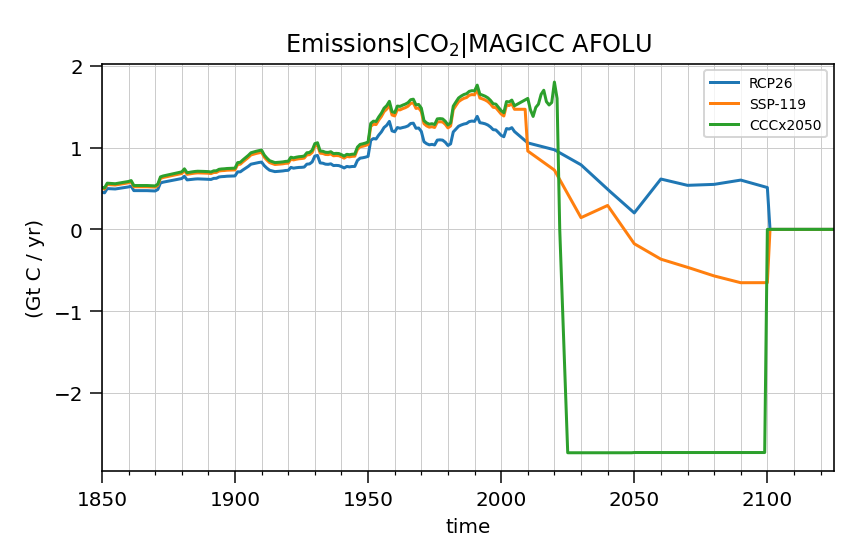
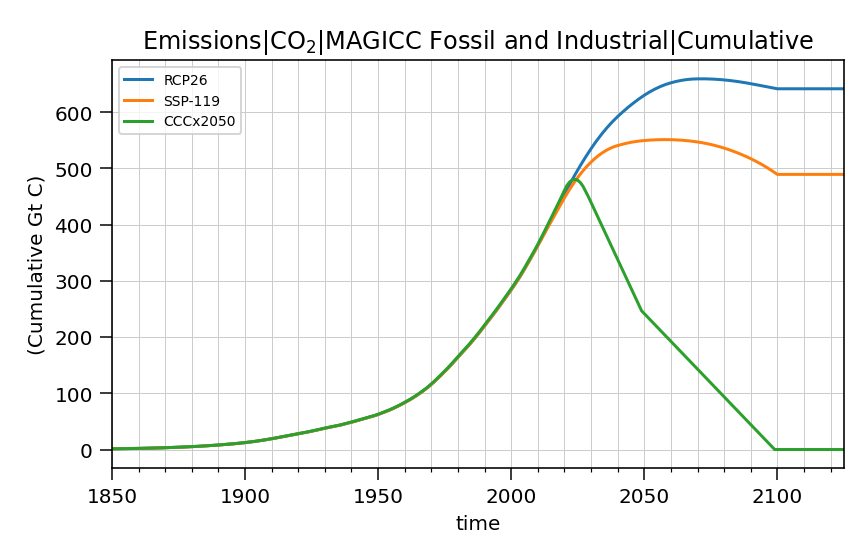
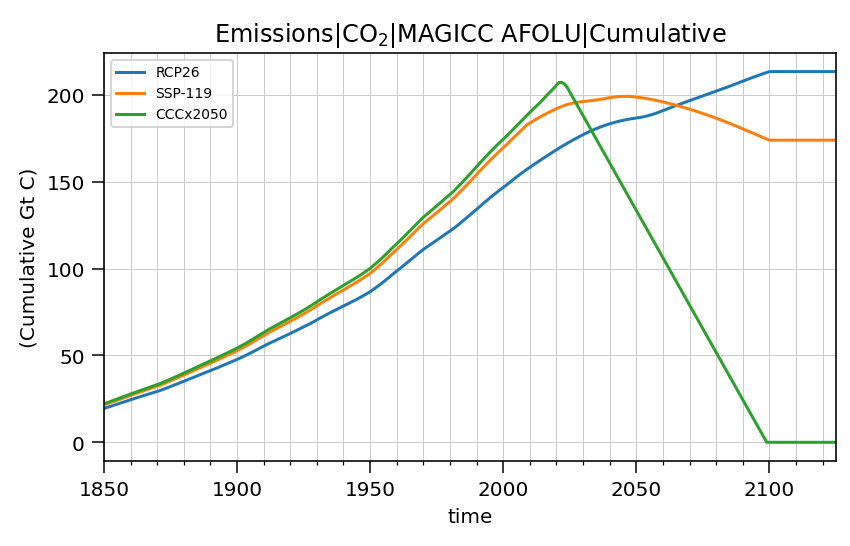
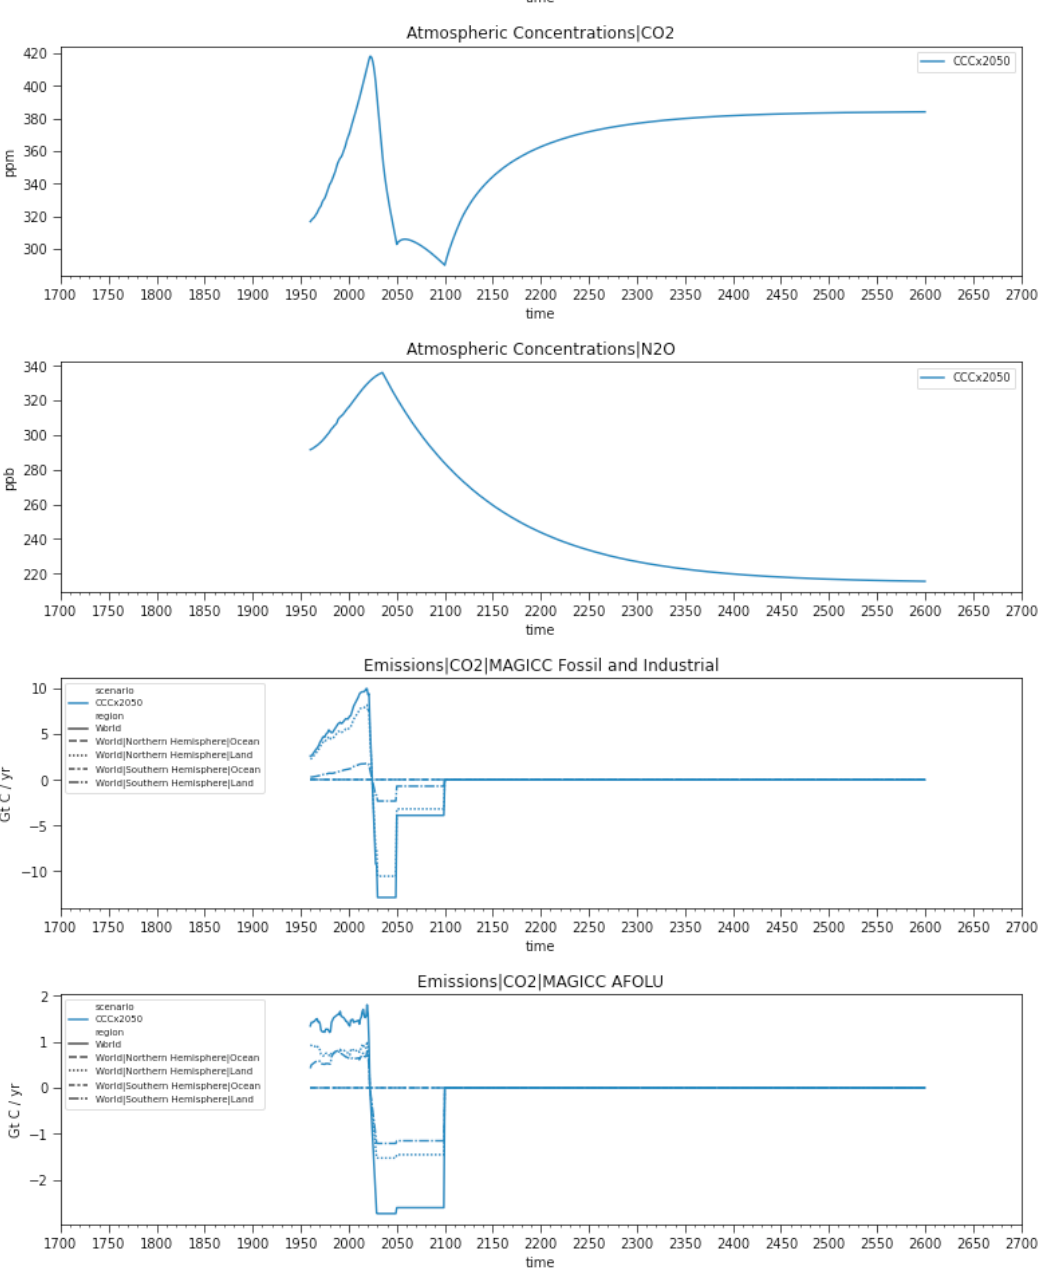
Carbon Dioxide Removal (CDR) was accomplished by negative emissions of carbon dioxide and phase-outs of methane and carbon monoxide as well as all other industrial fossil fuel-based gases excluding ammonia ending by 2100. As a negative quantity of emissions is specified but not a technology or set of technologies, the removals are agnostic to the type of implementation. The front-loaded CDR and phase-outs of methane and carbon monoxide also realize about 300 ppm by 2050. The novel high removal pathway experiment is listed as CCCx2050 or referred to as 300 x 2050 pathway within this text.

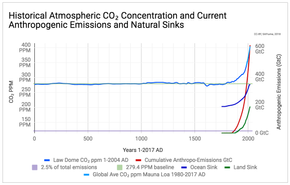
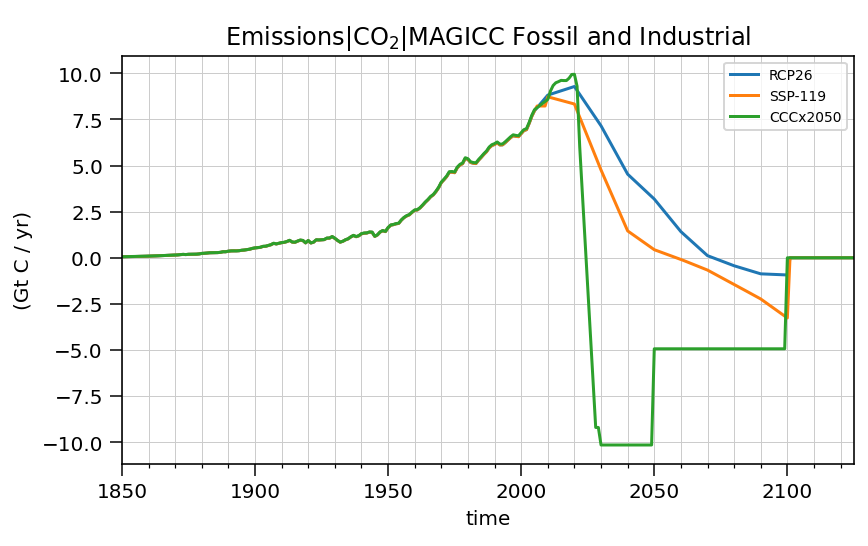
Figure 1. Pathways RCP2.6, CCCx2050, and SSP1-1.9 show emissions and emissions reductions starting in 2010 through 2125. Historical emissions through 2020 are included in the pathway 300 x 2050.
The 300 x 2050 pathway removed about a total of 243.7 GtC or 892.8 GtCO2 for fossil fuel emissions by 2050, and 76.4 GtC or 280 GtCO2 of Land-use change emissions by 2050.
It removes all anthropogenic fossil fuel emissions equaling 480.5 GtC or 1760.7 GtCO2 by 2100. And it removes all anthropogenic land-use change emissions totaling 207.3 GtC or 759.4 GtCO2 by 2100.
The yearly rates are in the table below: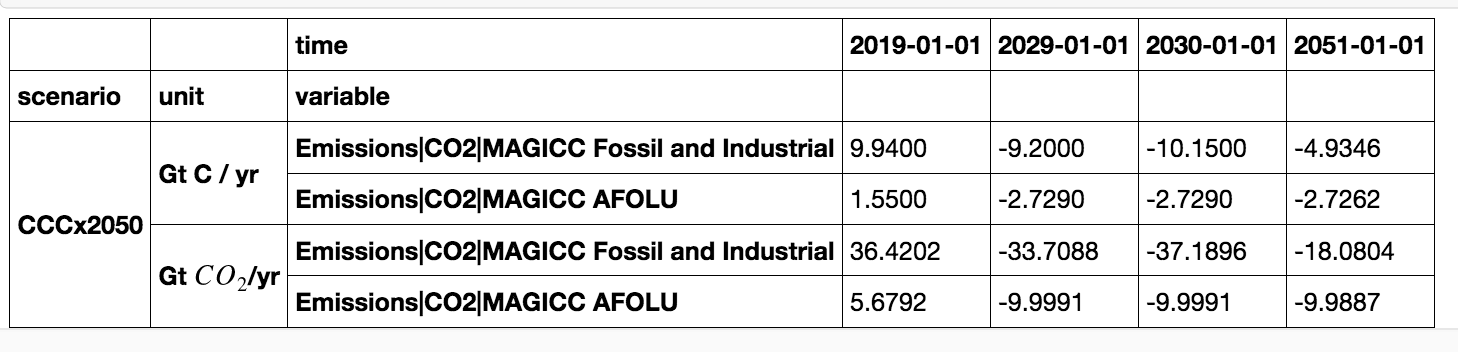
Table 1: Yearly rates of negative emissions for 300 x 2050 experimental pathway.
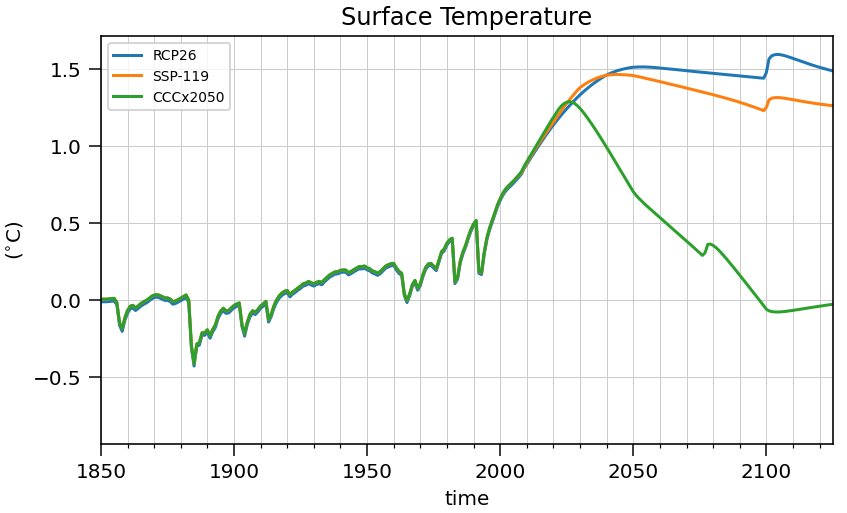
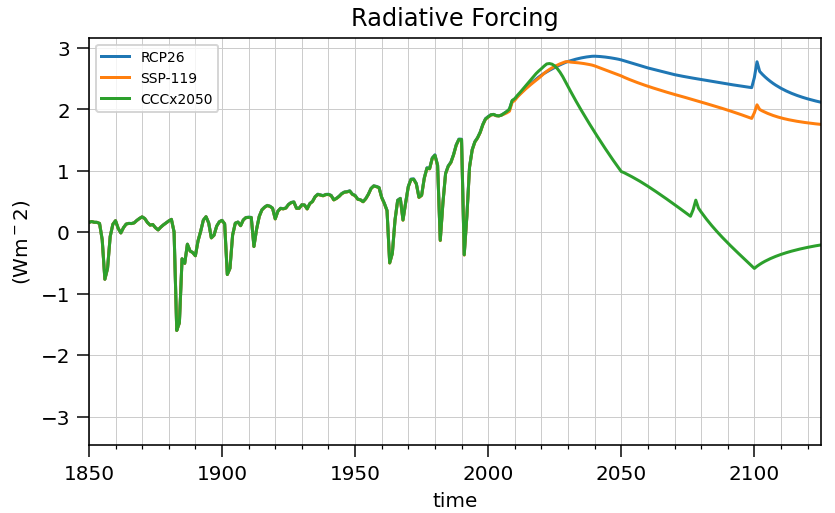
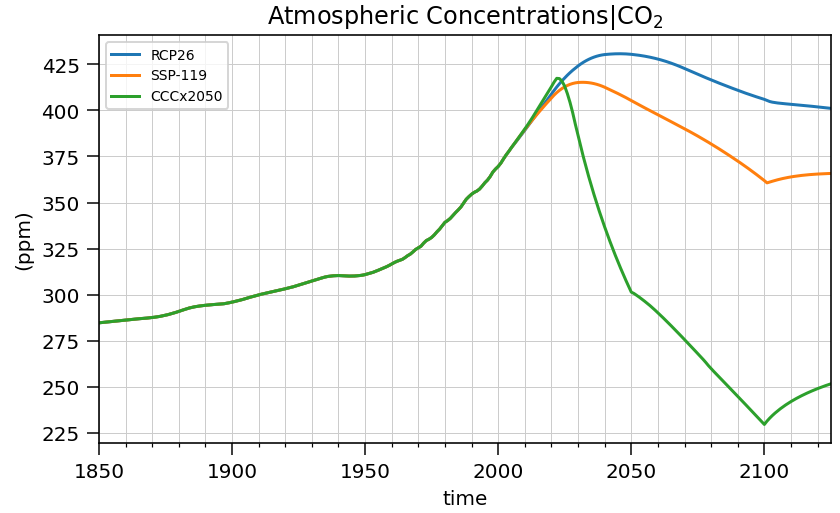
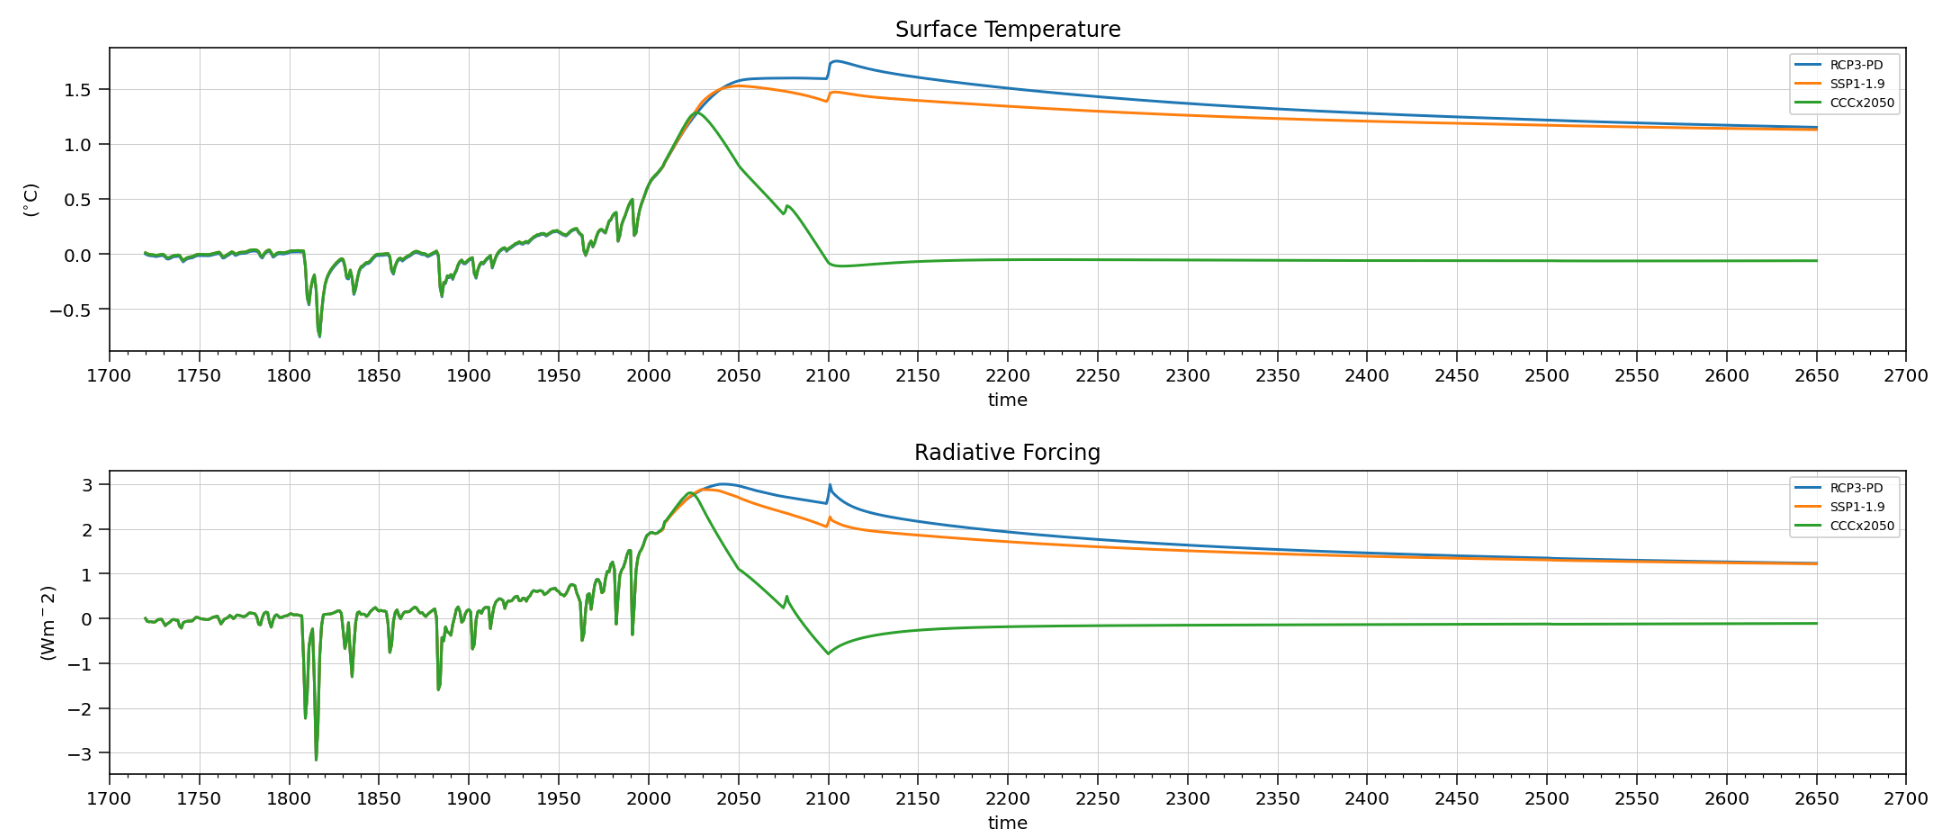
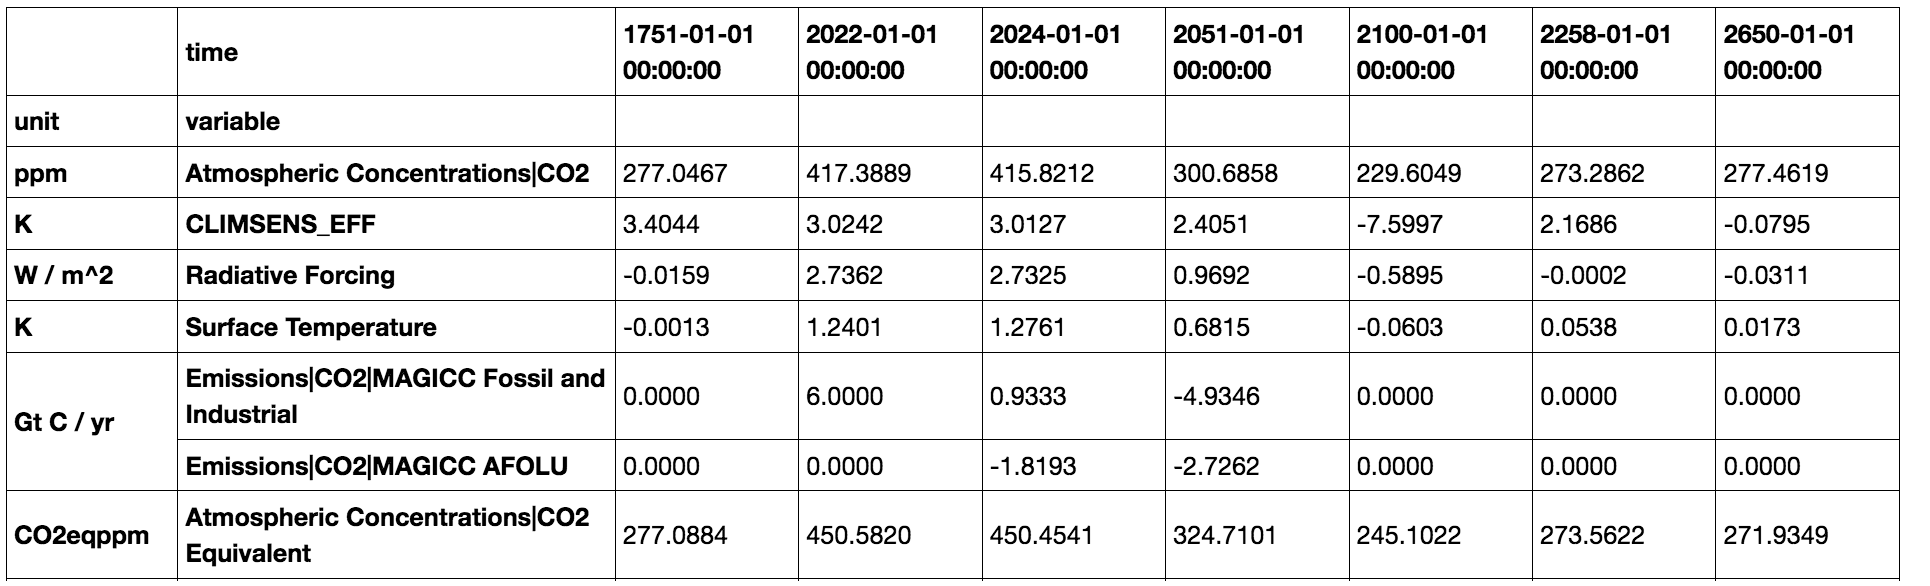
These types of removals, when run in the calibrated model, resulted in the following declines in global temperature, radiative forcing, CO2-eq concentration, and CO2 concentration.
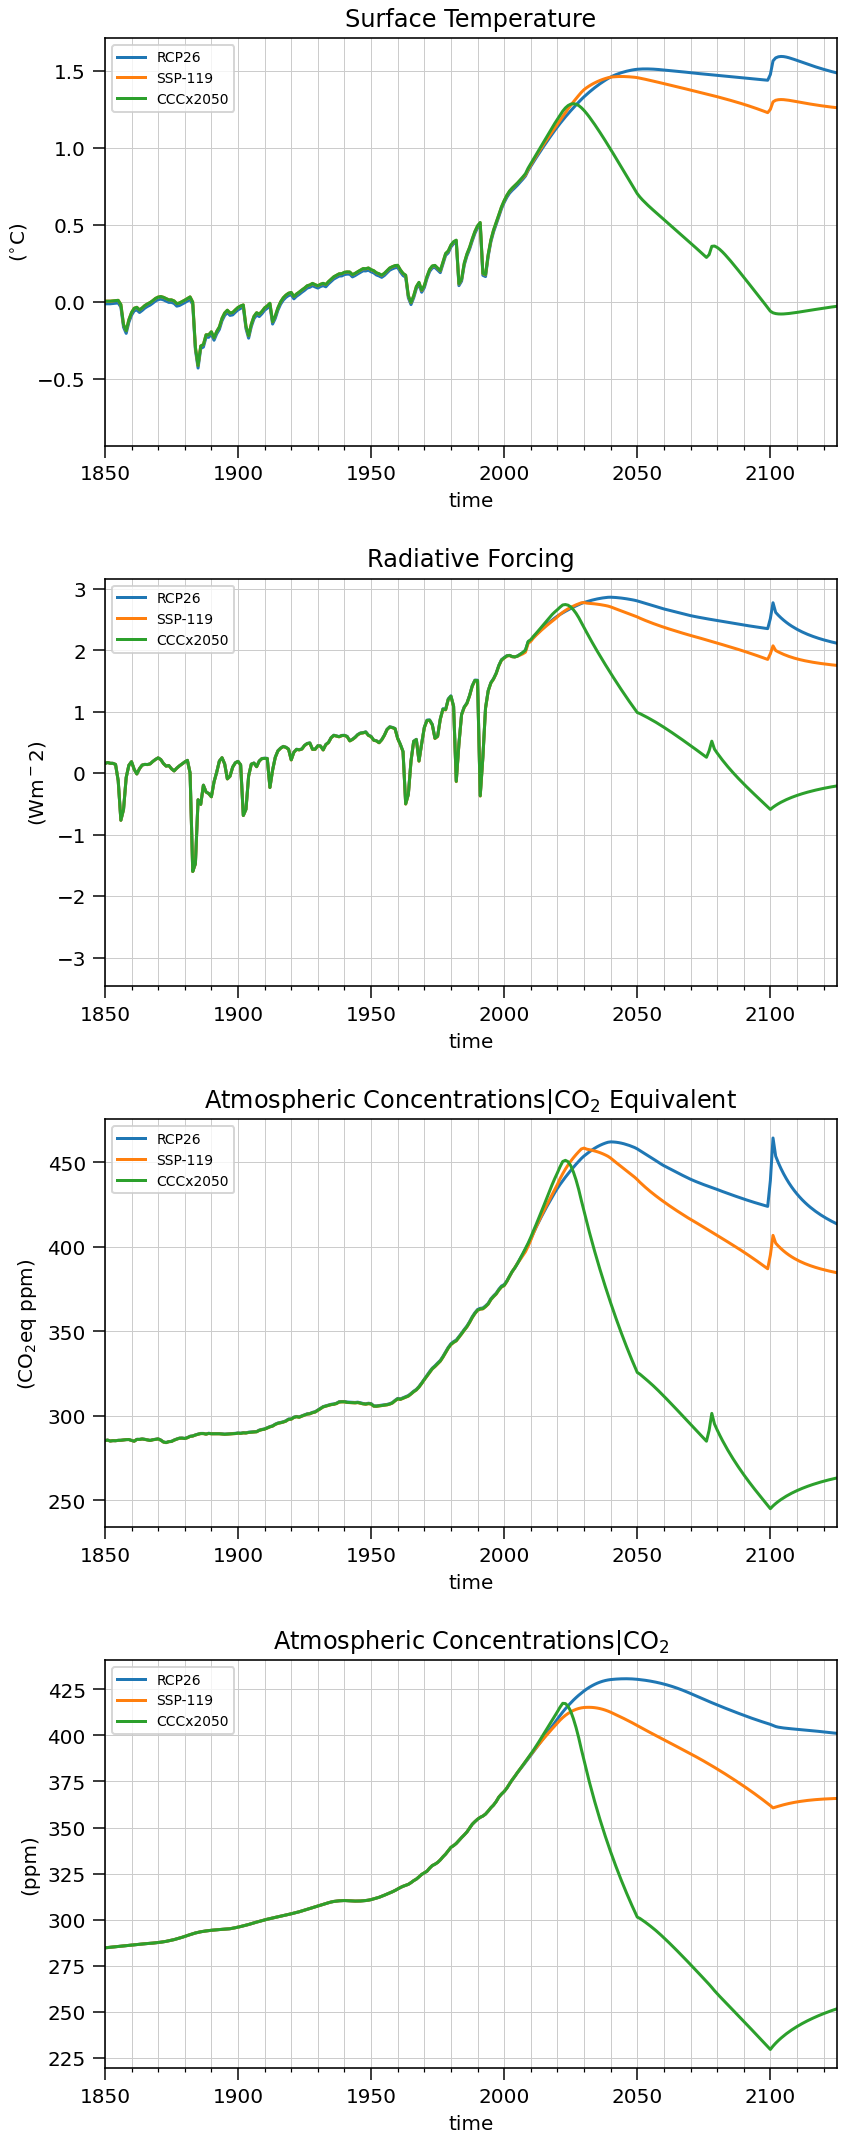
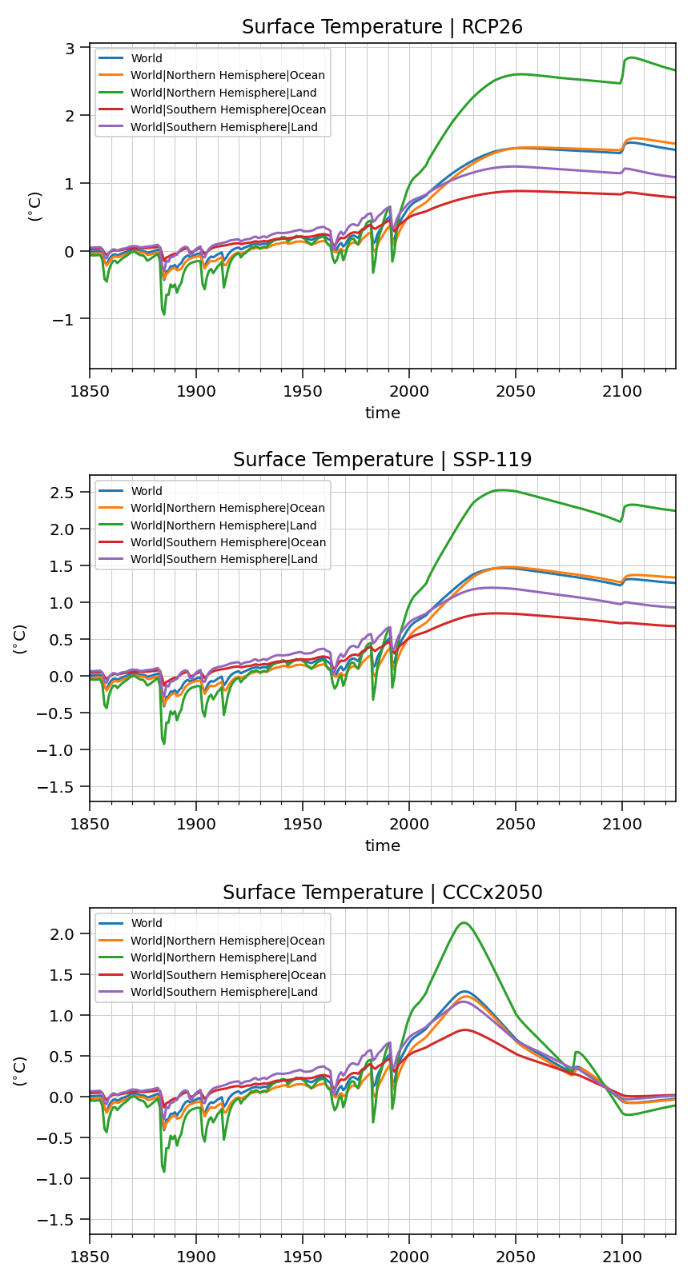
Figure 2 (a-d): Surface Temperature, Radiative Forcing, CO2-eq and CO2 for the experimental, RCP 2.6 and SSP1-1.9 over the time 1850-2125.
Methods
Experiment Settings
To better calibrate MAGICC to emulate a CMIP model, the HadCRUT5 (2020) temperature data analysis was used to line-fit the average of the last five years. The anthropogenic carbon dioxide emissions data from the Global Carbon Budget (2020) was used to calibrate and extend the carbon dioxide emissions data from 2009 to 2020 (estimated). MAGICC 6.8 was last harmonized with 2010 data around 2011.
N2O data caused a noticeable spike after severely decreasing emissions; MAGICC 6.8, which was finalized in 2012, does seem to artificially hold this value high for a few years after a large emissions reduction resulting in the artifact around the year 2079 for the 300 x 2050 pathway or at 2100 for the standard scenarios. In order to better smooth out the declining curves for 300 x 2050, all GHGs were declined to phase out by 2079, except ammonia, and the negative carbon dioxide (both fossil fuel and land-use change) emissions. It is left to further study under models not subject to this same N2O artifact if GHG phase-outs can happen closer to 2050 and would that lower the total number of removal necessary to reach 0ºC.
Equilibrium Climate Sensitivity (ECS) was calibrated to 3.12ºC after checking the literature, performing a rough pass calibration of the HadCRUT5 temperature dataset, double-checking ECS by hand using MAGICC CO2 and HadCRUT5 datasets, and then taking roughly 65% of the delta from the two climate sensitivity fittings. ECS would trend up after each calibration run as the other MAGICC settings were set to absorb the response such that the temperatures were consistent.
The experiment was calibrated for negative emissions by adapting the supplied pymagicc code to utilize the CMIP6 abrupt-0p5xCO2 and 1pctCO2-cdr test and generate Estimated Climate Sensitivity (a doubling or halving of CO2 concentration over the entire timeframe), Transient Climate Response (TCR), and Transient Climate Response to cumulative Emissions (TCRE).
The absolute value of TCR and TCRE are equal, and ECS results in a slight difference of about 0.0152ºC and is still an acceptable demonstration of negative emissions given the tests proceed over 2500 years.
Calculating ECS from abrupt-2xCO2.
Calculating TCR & TCRE from 1pctCO2.
TCR is 2.0314, ECS is 3.1035 kelvin and TCRE is 2.354257 kelvin / 1000 GtC
Calculating ECS from abrupt-0p5xCO2.
Calculating TCR & TCRE from 1pctCO2-cdr.
TCR is 2.0314, ECS is 3.1187 kelvin and TCRE is 2.354257 kelvin / 1000 GtC
Tuned Settings
The following settings were tuned to better line-fit the HadCRUT5 temperature analysis, and GCB 2020 emissions data.Climate Sensitivity was set to (ECS): 3.12°C
Land-Oceanwarmingratioat equilibrium (∆T_l/∆T_o): 'core_rlo' : 1.92
Heat exchange: 'core_heatxchange_landocean' : 1.63
Heat exchange amplification: 'core_amplify_ocn2land_heatxchng' : 1
North to South Heat Exchange: 'core_heatxchange_northsouth' : 0.3115475
Start of preindustrial concentration (1765): 'co2_preindco2conc' : 276.744
Gross Primary Product: 'co2_feedbackfactor_gpp' : .04
Preindustrial Baseline, 1720-1800
A baseline of 1720-1800 was chosen per Estimating Changes in Global Temperature since the Preindustrial Period, 2017, as mentioned in Trajectories of the Earth System in the Anthropocene, 2018, which resulted in temperatures 0.066ºC warmer than the 1850-1900 baseline.
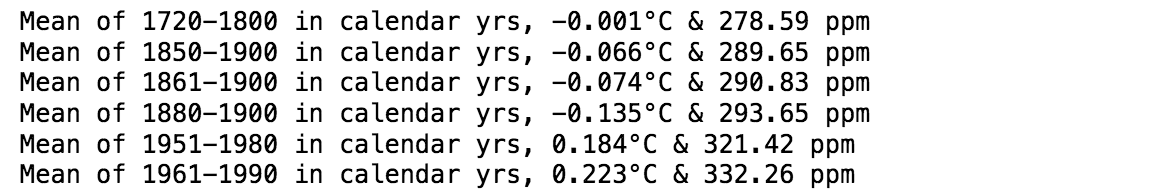
The earlier baseline choice also avoids hysteresis seen if the model time series start is after 1765. A post-1765 start never reached a temperature about 0ºC by 2500. Additional details in Supplemental Data section.
Discussion
Model Temperature Calibration
When calibrating for the Northern and Southern regions for the HadCRUT5 analysis, the model evolved the northern hemisphere and southern hemisphere Ocean, and hemisphere respective land binning. The model was calibrated to achieve a delta of .0004ºC for the world and a little over .04ºC for the northern hemisphere and the southern hemisphere.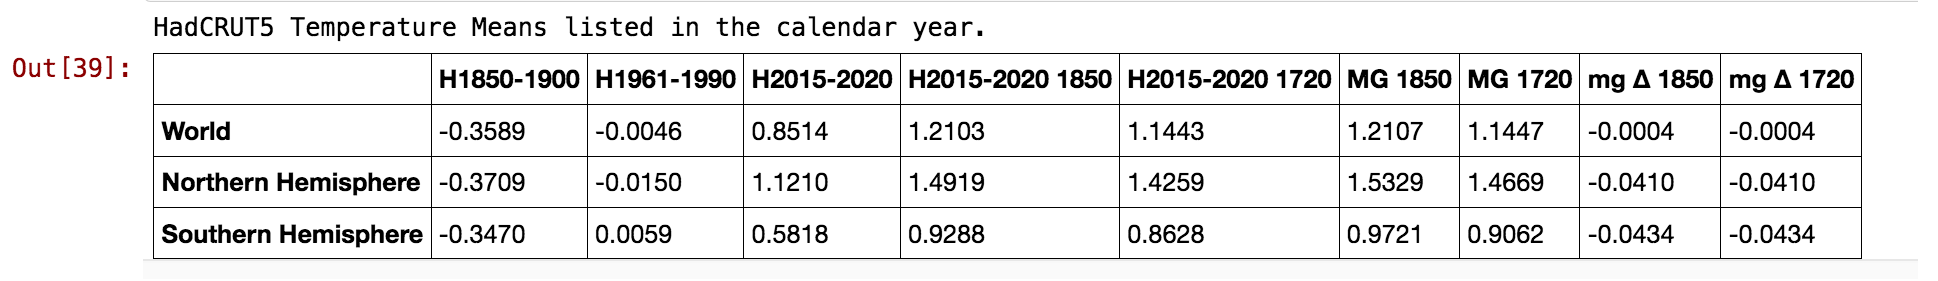
The calibration to recent temperature forcing and recent emissions as of 2020, to match final temperature, changed the amplitude of the temperature graphs over an untuned configuration. The experimental pathway 300 x 2050 for 2000-2020 reflects a more closer match to the temperature and CO2 evolution for near future dates, i.e: the 300 x 2050 pathway's calendar year 2021 was predicted to reach 1.24ºC and a CO2 concentration of 417ppm. This is visually noticeable (see figure 2) by the divergence of 300 x 2050 from the harmonized RCP 2.6 and SSP1-1.9 starting about 2015. For an accounting of real-life emissions and temperature modeling, the latest data imported is highly recommended.
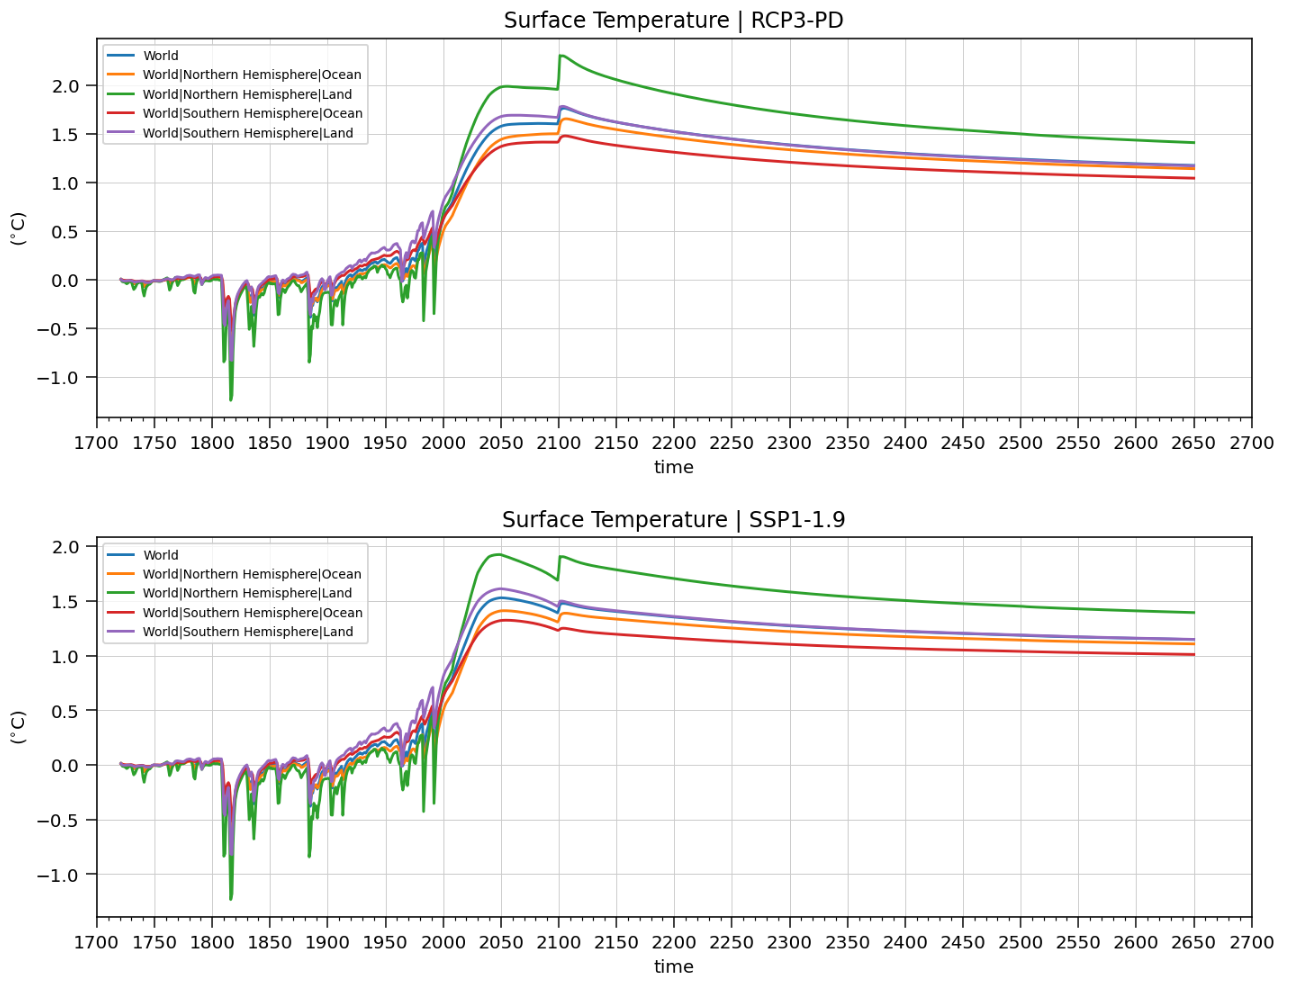
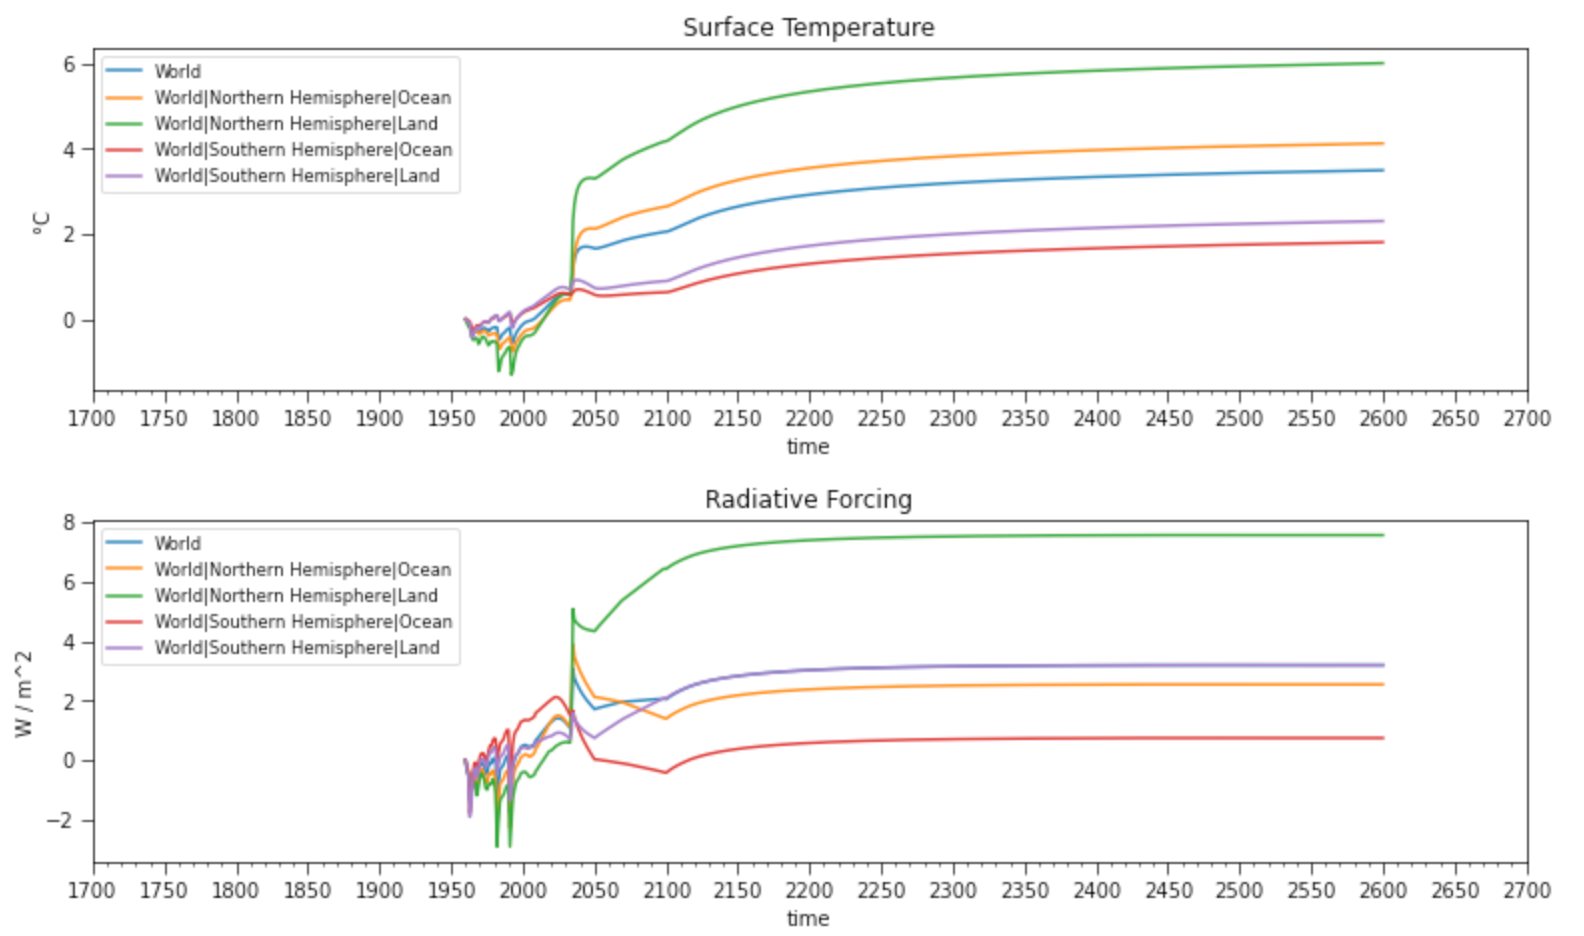
Calibration and Regionality
Assuming the ratio of land to ocean and heat exchange settings are correct, the model expects a temperature evolution shown in the successive figures. The northern hemisphere with the most developed land experiences the majority of the warming, second to the northern hemispheric ocean followed by the southern hemispheric land, and finally the ocean. This is common among all modeled experiments in this series. A word of caution, the regional splitting of these temperature projections is a theoretical experiment that has not been verified or otherwise peer-reviewed and is not to be used as conclusive evidence of a future projection of temperature in a given region.
If the regionality to temperature increases and decreases in the case of the 300 x 2050 pathway is approximately correct it provides additional data that these next two decades are critical to lowering global temperatures.
MAGICC 6.8 Negative Emissions Calibration
The negative emissions calibration was performed by verifying that the absolute value of TCR and TCRE are equal. This was performed by the CMIP6 tests abrupt-0p5xCO2 and CDRMIP 1pctCO2-cdr tests compared to an abrupt doubling of emissions and 1% CO2 increase tests, respectively. When removing all anthropogenic emissions from both fossil fuel emissions and land-use change the system was able to achieve -0.0709ºC over the mean temperature for 1720-1800 or -0.13ºC over the mean temperature for 1850-1900. The inclusion of cumulative land-use change for removal was unexpected and unanticipated over the author's previous theory paper.
Ocean outgassing is inferred as all fossil fuel emissions had to be removed in addition to the emissions that currently reside in the atmosphere. A removal to roughly realize 300 ppm of CO2 by 2050 (243.7 GtC modeled, compared to 415 ppm - 300 ppm * 2.124 (GtC/ppm) = 244.26 GtC), needed additional removal to counterbalance the effect of the ocean reestablishing pCO2 equilibrium (resulted in outgassing) which was completed by 2100. This did allow both temperature and CO2 slowly recovered to finally converge to match pre-industrial. CO2 concentration does drop well below 230 ppm, however, CO2eq only drops below 245 ppm, all the while the global temperature mean never goes lower than -0.06ºC. The ocean heat exchange, drop in concentration from emissions forcings, N2O artifact and GHGs phaseouts introduce enough varying factors that complicate modeling which might only be fully understood when modeled in a full ESM ensemble.
Accounting of Land Use Change Emissions
The author was unable to find guidance on increasing the land sink or a MAGICC 6.8 setting to allow more below ground mineralization of anthropogenic land-use change CO2 to remove it from the ocean or atmosphere sinks. The author doesn't know if there should be a portion of the cumulative land-use emissions that should have turned over to durable storage of CO2 in a mineralized form. It was suspected and thus written as such in the theory paper that land-use change emissions shouldn't need to be removed as they are fully in balance as it were, with the cumulative increases to the land sink since preindustrial. This topic is open to investigation.
|
|
|
|
Negative Emissions Calibration and Negative Emissions Asymmetry
The 300 x 2050 pathway experiment has a total removal of 724.20 GtC in negative emissions to match the cumulative total of anthropogenic emissions. If more land-use change emissions were more permanently contained within the land sink whereby the quantity of negative emissions needed was reduced to about 500GtC, then the removal is within the model ensemble variability of AOGCM model and natural sink uptake studies. If all anthropogenic negative emissions since preindustrial 724.20 GtC or 2653.5 GtCO2 are needed to reach closer to 0ºC over preindustrial, then it's likely that a small quantity more than what was emitted since preindustrial be added this experiment's modeled removal of all of anthropogenic. The magnitude over 500GtC to determine the magnitude of CDR necessary to match pre-industrial temperatures is open for in-depth investigation.
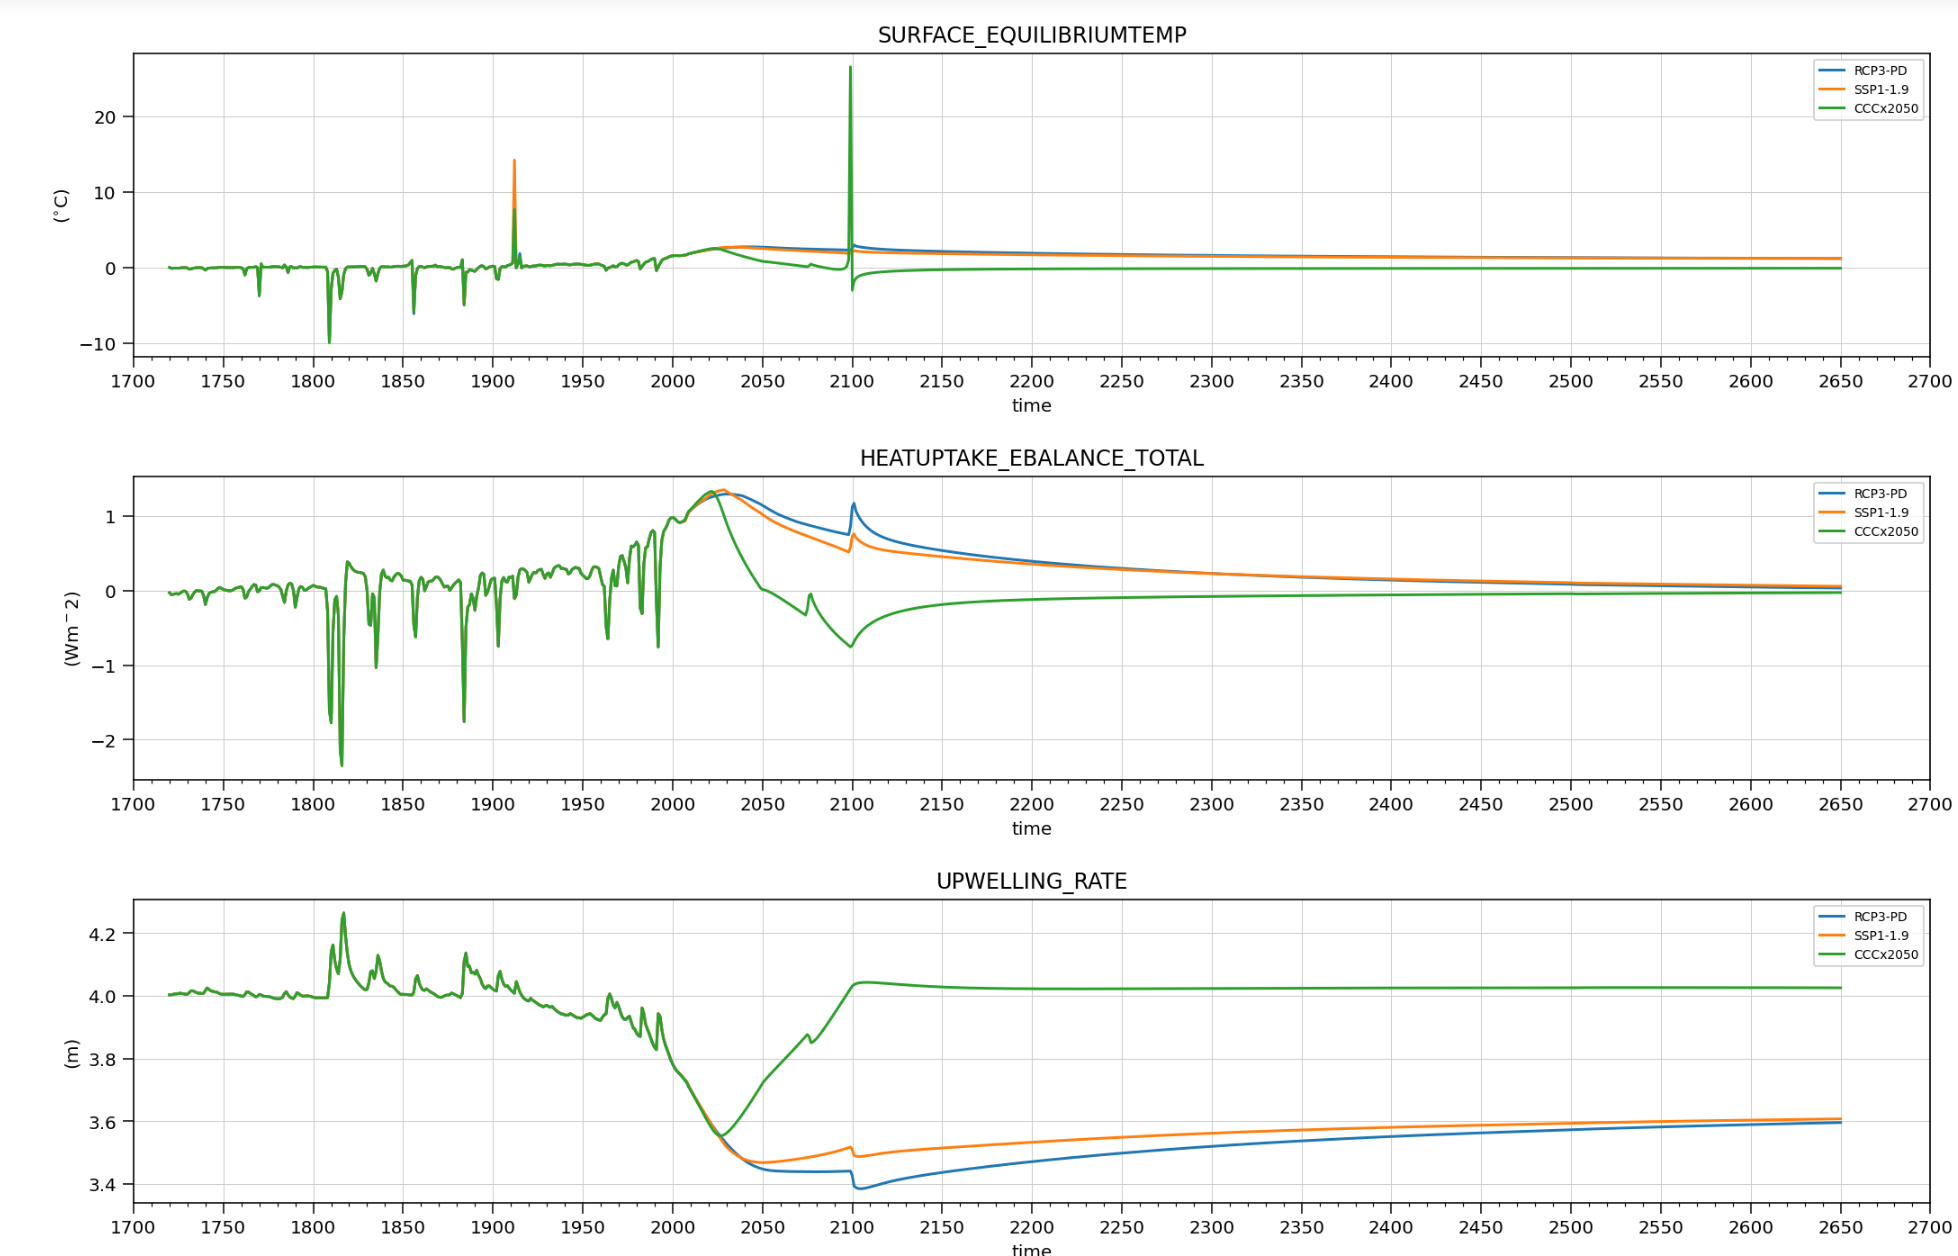
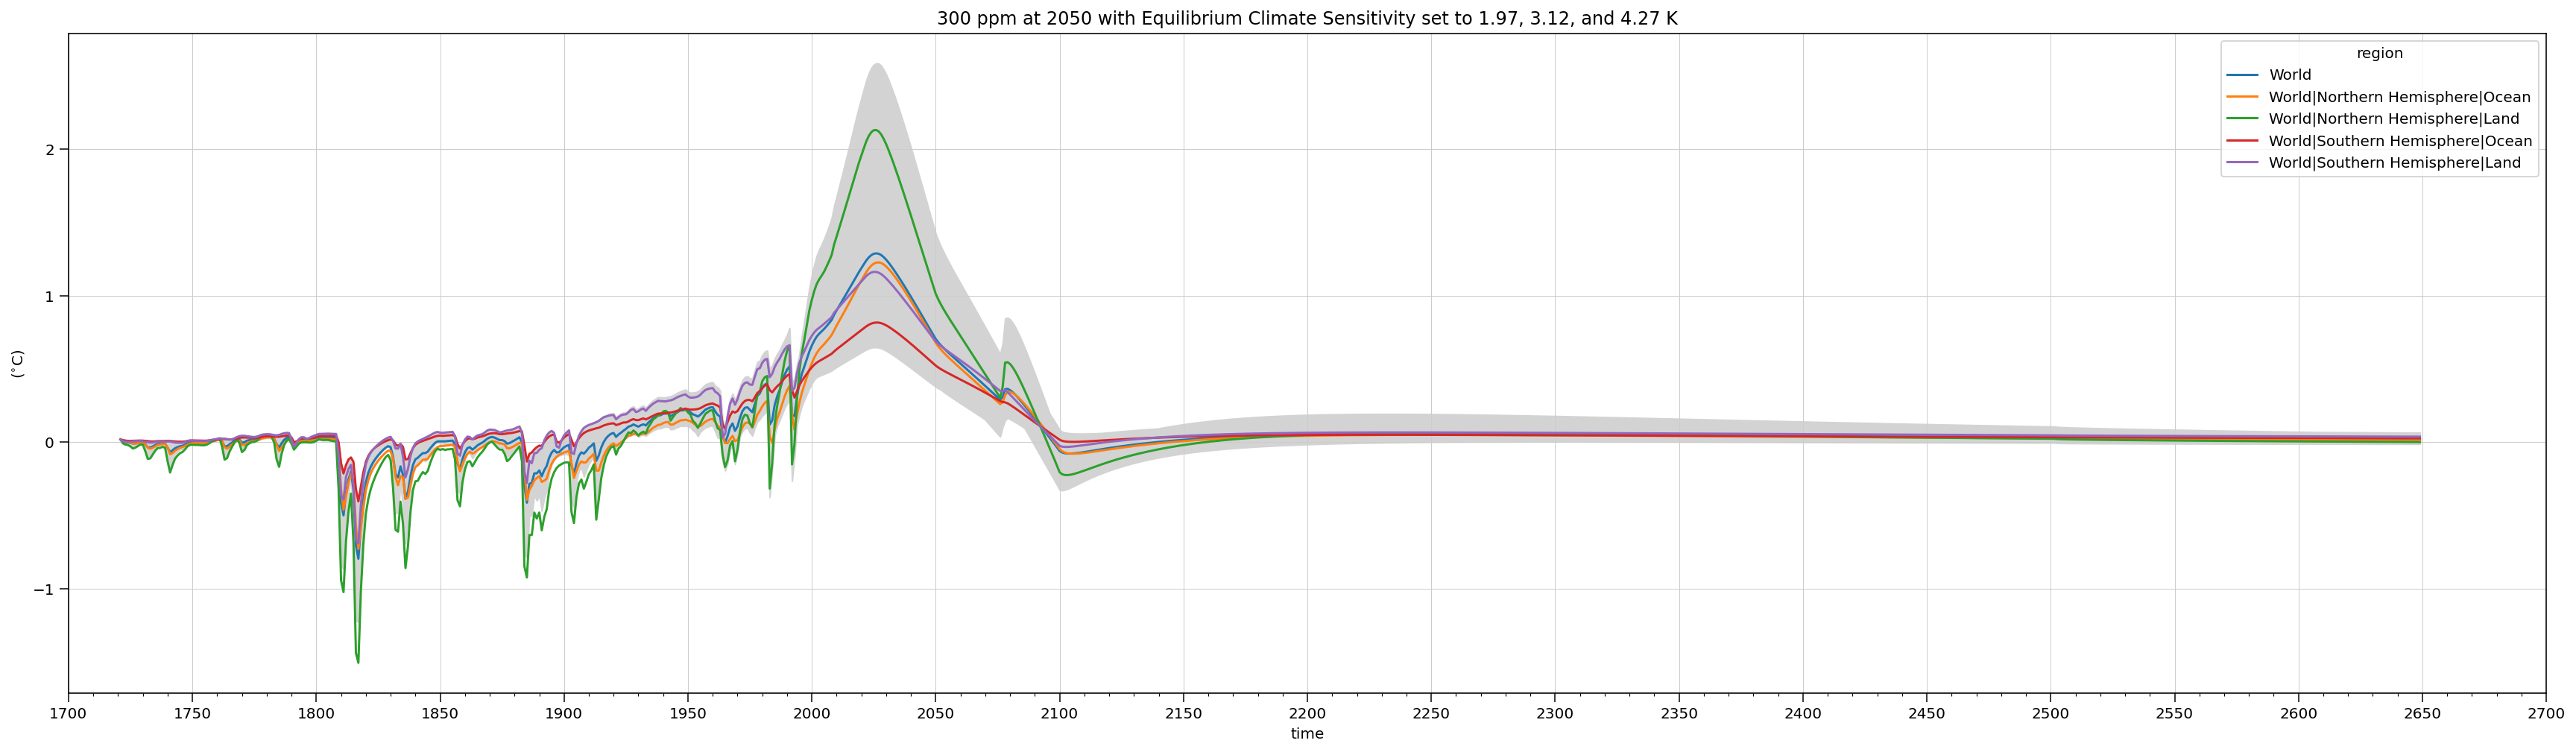
Experimental Temperature Evolution over Model Time Bounds
If negative emissions have a nearly symmetrical climate carbon-cycle response, extending the experiment 300 ppm by 2050 out to the model limits will evolve an eventual convergence to about 0ºC. The shading indicates the experiment run with a lower ECS of 1.97ºC and a higher ECS of 4.27ºC and includes the high uncertainty region splitting (note: heat exchange to generate region splitting in temperature is still open for future investigation). Given the vast quantity of emissions needed to be removed under such a short time period, it radically limits the amount of near-term emissions allowable and likely is only achievable should we limit emissions to stay well within the carbon budget. A continued dependency on fossil fuels is unable to yield phase-outs in emissions or the deep removals necessary to achieve the scale and scope to match pre-industrial temperature.
Conclusion
This paper outlines starting points for future investigation on pathways that closely match pre-industrial over existing literature. Having a team explore the experiment's thesis of 1.6x preindustrial concentration driven from forcings from emissions, and removing upwards of 600GtC (or 2198.4GtCO2), run with current temperature forcings, and run on a more comprehensive model ensemble would best provide more accurate reflections of temperature, holding below 1.5ºC, and additional data such as the sea-level rise and AMOC, ENSO, jetstream turnover, and evolution over time.
The possibility of being able to eventually match pre-industrial should help to inform the debate to radically accelerate front-loaded, near-term phase-out of anthropogenic emissions sources and scale zero-carbon intensity carbon removals in order to develop a more equal future world.
Data Availablity
2021 Code and Data Repository
The experimental data for 300 x 2050 is cached in the workbook within the Github repository. This data can be regenerated by downloading the repository and possibly installing wine if on non-windows application binary based platform, i.e: Linux, macOS, UNIX, etc.
CDR Modeling Experiment Github repository: https://github.com/hsbay/cdrmex
Dependencies
wine - Wine Is Not an Emulator, emulation software for running Windows programs on Linux and Unixes including MacOS
Pymagicc will install the following: MAGICC 6.801 and jupyter
SSP Database, International Institute for Applied Systems Analysis: https://tntcat.iiasa.ac.at/SspDb, About page
Bugs/Issues
Issue Status | Title |
Open | https://github.com/hsbay/cdrmex/issues?q=is%3Aopen+is%3Aissue |
Supplemental Data
Alternate figures showing model exceptions to input data.
Figures a-d, wide errors appear shortly after reaching large scale negative emissions (from e-f) when using MAGICC 6.8 with a starting point at 1950 irrespective of a baseline adjustment. The CDRMEx baseline adjustment code was completely removed during this test run. As MAGICC 6.8 was not previously calibrated for negative emissions, the negative emissions calibration is conditional that the series starts before 1766.
Funding
Anonymous sponsor retired from semiconductor manufacturing, software entrepreneur, Timothee Besset, US economic stimulus. The funding goal has not been met, consider sponsoring: https://github.com/sponsors/safiume.
References
Pymagicc: A Python wrapper for the simple climate model MAGICC, 2018, R. Gieseke, S. N. Willner and M. Mengel, Journal of Open Source Software, 3(22), 516, DOI: 10.21105/joss.00516
Emulating coupled atmosphere-ocean and carbon cycle models with a simpler model, MAGICC6 – Part 1: Model description and calibration, 2011, Meinshausen, M., Raper, S. C. B., and Wigley, T. M. L., Atmos. Chem. Phys., 11, 1417-1456, DOI: 10.5194/acp-11-1417-2011
Emulating atmosphere-ocean and carbon cycle models with a simpler model, MAGICC6 – Part 2: Applications, 2011, Meinshausen, M., Wigley, T. M. L., and Raper, S. C. B., Atmos. Chem. Phys.,11, 1457–1471, DOI: 10.5194/acp-11-1457-2011
Scenarios towards limiting global mean temperature increase below 1.5 °C, Rogelj, J., Popp, A., Calvin, K.V. et al., Nature Clim Change 8, 325–332 (2018). DOI: 10.1038/s41558-018-0091-3
Global Carbon Project. (2020). Supplemental data of Global Carbon Budget 2020 (Version 1.0), Friedlingstein, Pierre, O'Sullivan, Michael, Jones, Matthew W., Andrew, Robbie M., Hauck, Judith, Olsen, Are, Peters, Glen P., Peters, Wouter, Pongratz, Julia, Sitch, Stephen, Le Quéré, Corinne, Canadell, Josep G., Ciais, Philippe, Jackson, Robert B., Alin, Simone, Aragão, Luiz E. O. C., Arneth, Almut, Arora, Vivek, Bates, Nicholas R., Becker, Meike, Benoit-Cattin, Alice, Bittig, Henry C., Bopp, Laurent, Bultan, Selma, Chandra, Naveen, Chevallier, Frédéric, Chini, Louise P., Evans, Wiley, Florentie, Liesbeth, Forster, Piers M., Gasser, Thomas, Gehlen, Marion, Gilfillan, Dennis, Gkritzalis, Thanos, Gregor, Luke, Gruber, Nicolas, Harris, Ian, Hartung, Kerstin, Haverd, Vanessa, Houghton, Richard A., Ilyina, Tatiana, Jain, Atul K., Joetzjer, Emilie, Kadono, Koji, Kato, Etsushi, Kitidis, Vassilis, Korsbakken, Jan Ivar, Landschützer, Peter, Lefèvre, Nathalie, Lenton, Andrew, Lienert, Sebastian, Liu, Zhu, Lombardozzi, Danica, Marland, Gregg, Metzl, Nicolas, Munro, David R., Nabel, Julia E. M. S., Nakaoka, Shin-Ichiro, Niwa, Yosuke, O'Brien, Kevin, Ono, Tsuneo, Palmer, Paul I., Pierrot, Denis, Poulter, Benjamin, Resplandy, Laure, Robertson, Eddy, Rödenbeck, Christian, Schwinger, Jörg, Séférian, Roland, Skjelvan, Ingunn, Smith, Adam J. P., Sutton, Adrienne J., Tanhua, Toste, Tans, Pieter P., Tian, Hanqin, Tilbrook, Bronte, van der Werf, Guido, Vuichard, Nicolas, Walker, Anthony P., Wanninkhof, Rik, Watson, Andrew J., Willis, David, Wiltshire, Andrew J., Yuan, Wenping, Yue, Xu, and Zaehle, Sönke, Earth Syst. Sci. Data, 12, 3269–3340, DOI: 10.18160/GCP-2020
The Shared Socioeconomic Pathways and their energy, land use, and greenhouse gas emissions implications: An overview, 2017, Keywan Riahi, Detlef P. van Vuuren, Elmar Kriegler, Jae Edmonds, Brian C. O’Neill, Shinichiro Fujimori, Nico Bauer, Katherine Calvin, Rob Dellink, Oliver Fricko, Wolfgang Lutz, Alexander Popp, Jesus Crespo Cuaresma, Samir KC, Marian Leimbach, Leiwen Jiang, Tom Kram, Shilpa Rao, Johannes Emmerling, Kristie Ebi, Tomoko Hasegawa, Petr Havlík, Florian Humpenöder, Lara Aleluia Da Silva, Steve Smith, Elke Stehfest, Valentina Bosetti, Jiyong Eom, David Gernaat, Toshihiko Masui, Joeri Rogelj, Jessica Strefler, Laurent Drouet, Volker Krey, Gunnar Luderer, Mathijs Harmsen, Kiyoshi Takahashi, Lavinia Baumstark, Jonathan C. Doelman, Mikiko Kainuma, Zbigniew Klimont, Giacomo Marangoni, Hermann Lotze-Campen, Michael Obersteiner, Andrzej Tabeau, Massimo Tavoni, Global Environmental Change, Volume 42, Pages 153-168, ISSN 0959-3780, DOI: 110.1016/j.gloenvcha.2016.05.009
IAMC 1.5°C Scenario Explorer and Data hosted by IIASA,https://data.ene.iiasa.ac.at/iamc-1.5c-explorer, https://data.ene.iiasa.ac.at/iamc-1.5c-explorer/#/license
Energy, land-use and greenhouse gas emissions trajectories under a green growth paradigm, SSP1, 2017, Detlef P. van Vuuren, Elke Stehfest, David E.H.J. Gernaat, Jonathan C. Doelman, Maarten van den Berg, Mathijs Harmsen, Harmen Sytze de Boer, Lex F. Bouwman, Vassilis Daioglou, Oreane Y. Edelenbosch, Bastien Girod, Tom Kram, Luis Lassaletta, Paul L. Lucas, Hans van Meijl, Christoph Müller, Bas J. van Ruijven, Sietske van der Sluis, Andrzej Tabeau, Global Environmental Change, Volume 42, Pages 237-250, ISSN 0959-3780, DOI: 10.1016/j.gloenvcha.2016.05.008
An updated assessment of near-surface temperature change from 1850: the HadCRUT5 dataset, 2020, Journal of Geophysical Research (Atmospheres), Morice, C.P., J.J. Kennedy, N.A. Rayner, J.P. Winn, E. Hogan, R.E. Killick, R.J.H. Dunn, T.J. Osborn, P.D. Jones and I.R. Simpson, DOI: 10.1029/2019JD032361
Estimating Changes in Global Temperature since the Preindustrial Period, 2017, Ed Hawkins, Pablo Ortega, Emma Suckling, Andrew Schurer, Gabi Hegerl, Phil Jones, Manoj Joshi, Timothy J. Osborn, Valérie Masson-Delmotte, Juliette Mignot, Peter Thorne, and Geert Jan van Oldenborgh, DOI: 10.1175/BAMS-D-16-0007.1
Halocarbon scenarios, ozone depletion potentials, and global warming potentials, 2007, Daniel, J.S., and G.J.M. Velders (Lead Authors), A.R. Douglass, P.M.D. Forster, D.A. Hauglustaine, I.S.A. Isaksen, L.J.M. Kuijpers,A. McCulloch, and T.J. Wallington, Chapter 8 in Scientific Assessment of Ozone Depletion: 2006, Global Ozone Research and Monitoring Project—Report No. 50, 572 pp., World Meteorological Organization, Geneva, Switzerland
Assessment Modeling Consortium & International Institute for Applied Systems Analysis, Huppmann, D., Kriegler, E., Krey, V., Riahi,K., Rogelj, J., Rose,S., Weyant, J., et al., (2018) https://doi.org/10.22022/SR15/08-2018.15429
Asymmetry in the climate-carbon cycle response to positive and negative CO2 emissions, 2021, Kirsten Zickfeld, Deven Azevedo, Sabine Mathesius, h. Damon Matthews, Nat. Clim. Chang. 11, 613–617, DOI: 10.1038/s41558-021-01061-2
| Anchor | ||||
|---|---|---|---|---|
|
The Carbon Dioxide Removal Model Intercomparison Project (CDR-MIP): Rationale and experimental protocol for CMIP6, 2018, Keller, D. P., Lenton, A., Scott, V., Vaughan, N. E., Bauer, N., Ji, D., Jones, C. D., Kravitz, B., Muri, H., and Zickfeld, K., Geosci. Model Dev., DOI: 10.5194/gmd-2017-168
Reduced Complexity Model Intercomparison Project Phase 1: introduction and evaluation of global-mean temperature response, 2020, Zebedee R. J. Nicholls, Malte Meinshausen, Jared Lewis, Robert Gieseke, Dietmar Dommenget, Kalyn Dorheim, Chen-Shuo Fan, Jan S. Fuglestvedt, Thomas Gasser, Ulrich Golüke, Philip Goodwin, Corinne Hartin, Austin P. Hope, Elmar Kriegler, Nicholas J. Leach, Davide Marchegiani, Laura A. McBride, Yann Quilcaille, Joeri Rogelj, Ross J. Salawitch, Bjørn H. Samset, Marit Sandstad, Alexey N. Shiklomanov, Ragnhild B. Skeie, Christopher J. Smith, Steve Smith, Katsumasa Tanaka, Junichi Tsutsui, and Zhiang Xie, DOI: 10.5194/gmd-13-5175-2020
Trajectories of the Earth System in the Anthropocene, 2018, Will Steffen, Johan Rockström, Katherine Richardson, Timothy M. Lenton, Carl Folke, Diana Liverman, Colin P. Summerhayes, Anthony D. Barnosky, Sarah E. Cornell, Michel Crucifix, Jonathan F. Donges, Ingo Fetzer, Steven J. Lade, Marten Scheffer, Ricarda Winkelmann, and Hans Joachim Schellnhuber, PNAS, vol. 115 no. 33 8252-8259, DOI: 10.1073/pnas.1810141115
Related References
Global Carbon Budget 2017, 2018, Le Quéré, C., Andrew, R. M., Friedlingstein, P., Sitch, S., Pongratz, J., Manning, A. C., Korsbakken, J. I., Peters, G. P., Canadell, J. G., Jackson, R. B., Boden, T. A., Tans, P. P., Andrews, O. D., Arora, V. K., Bakker, D. C. E., Barbero, L., Becker, M., Betts, R. A., Bopp, L., Chevallier, F., Chini, L. P., Ciais, P., Cosca, C. E., Cross, J., Currie, K., Gasser, T., Harris, I., Hauck, J., Haverd, V., Houghton, R. A., Hunt, C. W., Hurtt, G., Ilyina, T., Jain, A. K., Kato, E., Kautz, M., Keeling, R. F., Klein Goldewijk, K., Körtzinger, A., Landschützer, P., Lefèvre, N., Lenton, A., Lienert, S., Lima, I., Lombardozzi, D., Metzl, N., Millero, F., Monteiro, P. M. S., Munro, D. R., Nabel, J. E. M. S., Nakaoka, S.-I., Nojiri, Y., Padin, X. A., Peregon, A., Pfeil, B., Pierrot, D., Poulter, B., Rehder, G., Reimer, J., Rödenbeck, C., Schwinger, J., Séférian, R., Skjelvan, I., Stocker, B. D., Tian, H., Tilbrook, B., Tubiello, F. N., van der Laan-Luijkx, I. T., van der Werf, G. R., van Heuven, S., Viovy, N., Vuichard, N., Walker, A. P., Watson, A. J., Wiltshire, A. J., Zaehle, S., and Zhu, D., Earth System Science Data, 10, pp. 405-448, DOI: 10.5194/essd-10-405-2018
Target atmospheric CO2: Where should humanity aim?, 2008, Hansen, J., M. Sato, P. Kharecha, D. Beerling, R. Berner, V. Masson-Delmotte, M. Pagani, M. Raymo, D.L. Royer, and J.C. Zachos, Open Atmos. Sci. J., 2, 217-231, DOI: 10.2174/1874282300802010217
Data and Code Availablity
Google Drive files
Presented Paper: Targeting All Anthropogenic Carbon Dioxide Emissions
Poster Presentation: Poster Slides
GitHub Repository